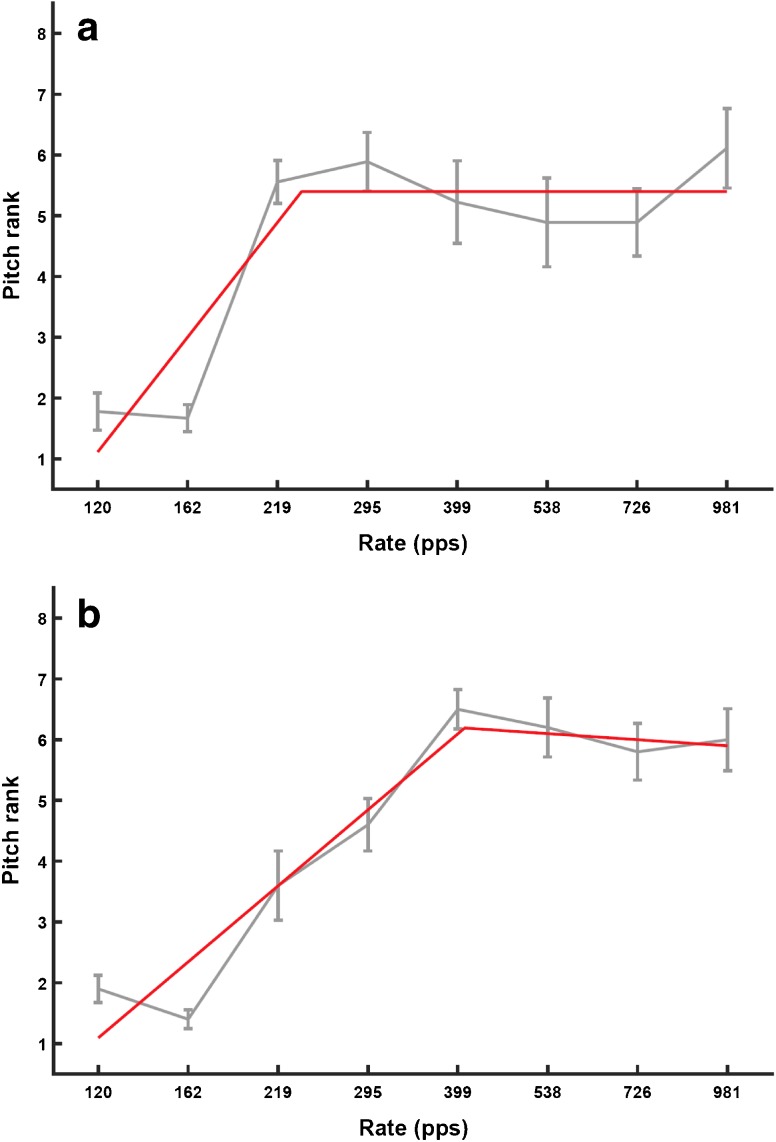
Fig. 1.
Grey lines show pitch-ranking functions with associated standard errors for one subject, obtained using the midpoint comparison procedure. Red lines show the broken-stick fits to the function. The upper limit is defined as the rate where the two parts of the stick meet. The two plots are for separate sessions

