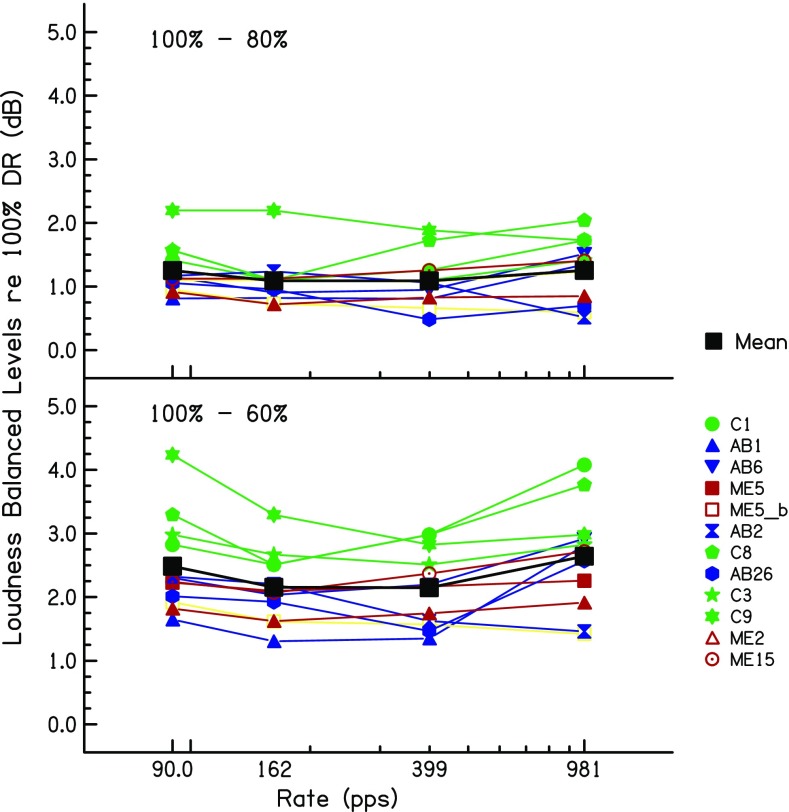
Fig. 11.
Loudness-balanced levels used in experiment 3, relative to 100 % DR, for the 80 %-DR (top) and 60 %-DR (bottom) conditions. Levels are plotted as a function of pulse rate. Coloured lines and symbol show data for individual listeners. The solid black squares connected by black lines show the mean levels across listeners

