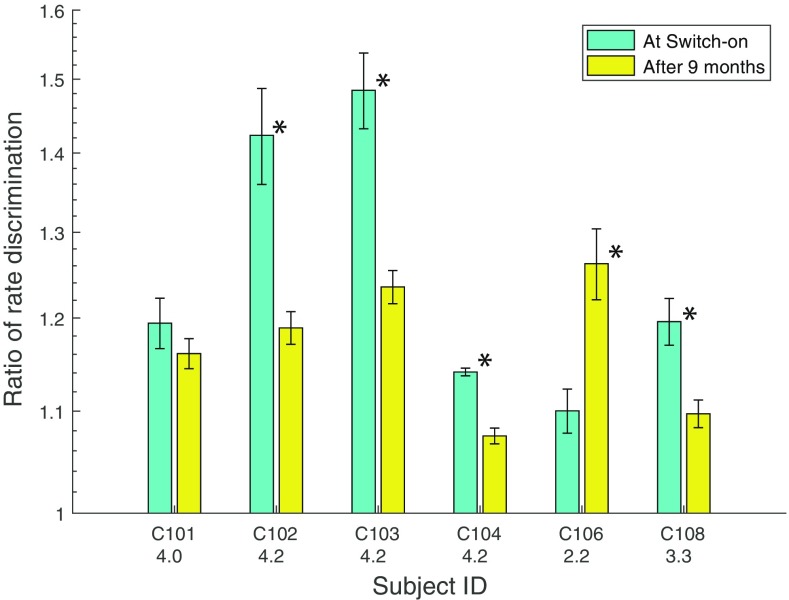
Fig. 7.
RDRs measured at 0 and 9 months after the day of activation, for six subjects. Significant differences between the two sessions are indicated by asterisks. Error bars show the standard error across runs. The number underneath each subject’s identifier on the abscissa shows the average loudness rating for the 0-month stimuli when judged at 9 months (see text for details)

