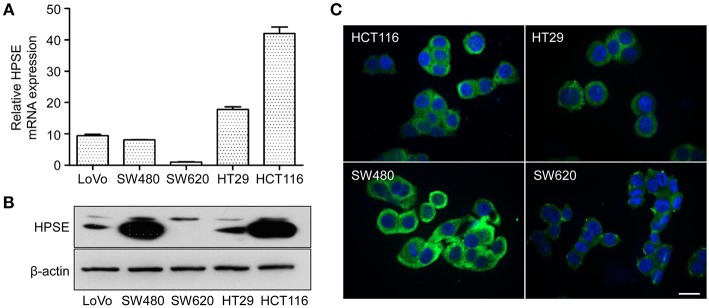
Figure 1.
HPSE expression in CRC cells. (A) Quantification of HPSE mRNA expression in different CRC cells. The expression of HPSE was normalized to β-actin. Results are shown as the fold change of CRC cells relative to SW620 cells. Results are representative of three independent experiments and are presented as the mean ± SEM. (B) Western blot analysis of HPSE expression in whole-cell lysates of CRC cells. SW480 and HCT116 cells exhibited higher expression of HPSE compared to the other cell lines. (C) Immunofluorescence staining demonstrated that HPSE was mainly localized in the cytoplasm of CRC cells. Green indicates HPSE and blue indicates DAPI. Scale bar, 20 μm.

