Figure 5.
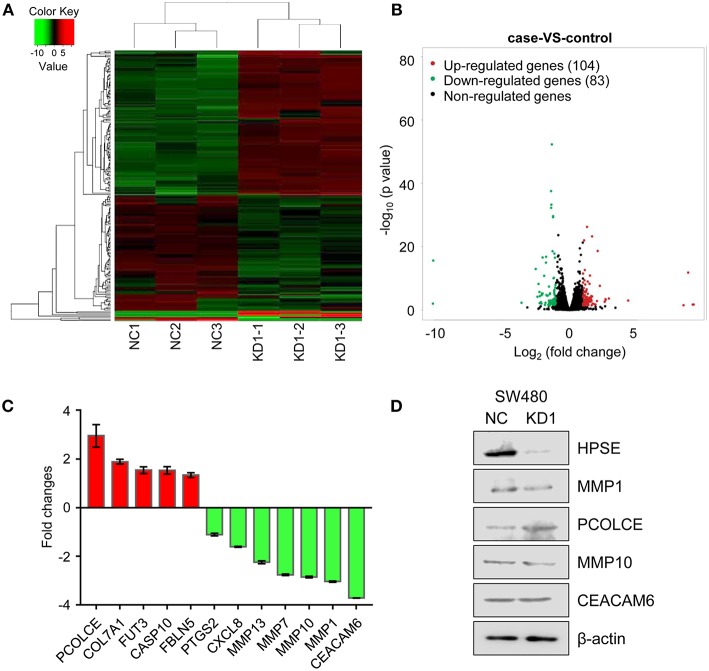
Differentially expressed genes across all samples. (A) Hierarchical clustering of differentially expressed mRNA between SW480-KD1 and SW480-NC cells. The relative levels of differentially expressed genes are depicted on the color scale. Red indicates increased relative expression and green indicates decreased relative expression. (B) Distribution of the differentially expressed genes is shown as a volcano plot. The detected genes are presented using log2 (fold change) on the x-axis and -log10 (p-value) on the y-axis. (C) Twelve differentially expressed genes were selected and validated using qRT-PCR. Results are representative of three independent experiments and are presented as the mean ± SEM. (D) The protein levels of HPSE, MMP1, PCOLCE, MMP10, and CEACAM6 were also validated by Western blot analysis. β-actin was used as internal control.

