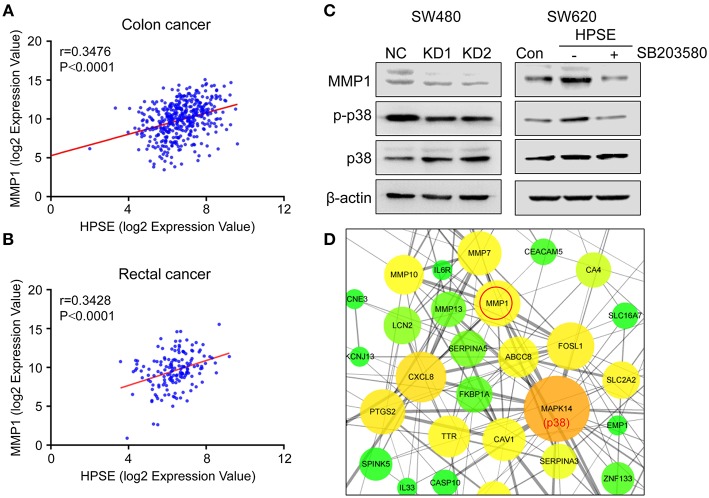
Figure 7.
Correlation between the expression of HPSE and MMP1 in colon cancer and rectal cancer. (A,B) Positive correlations between the transcriptional levels of HPSE and MMP1 in (A) colon cancer and (B) rectal cancer. These analyses were performed by analyzing colon and rectal cancer data from TCGA. The correlation between gene expression levels was analyzed by the Pearson correlation test. (C) Western blot analysis of MMP1, p38, and p-p38 expression upon knockdown of HPSE (left panel) and overexpression of HPSE (right panel). SW620-HPSE cells were treated with or without p38 pathway inhibitor (SB203580, 10 μM). (D) The interactions of the DEGs identified from RNA-seq analysis were extracted from STRING database and visualized using Cytoscape software. The nodes represent proteins and edges represent pairwise interactions. The size of the nodes is proportional to the number of connections established with other genes. The color, from green to red, is used to measure betweenness centrality (BC). The BC quantifies how drastically a gene influences the structure of the whole network. p38 has the largest number of neighboring proteins and MMP1 is tightly linked to p38.

