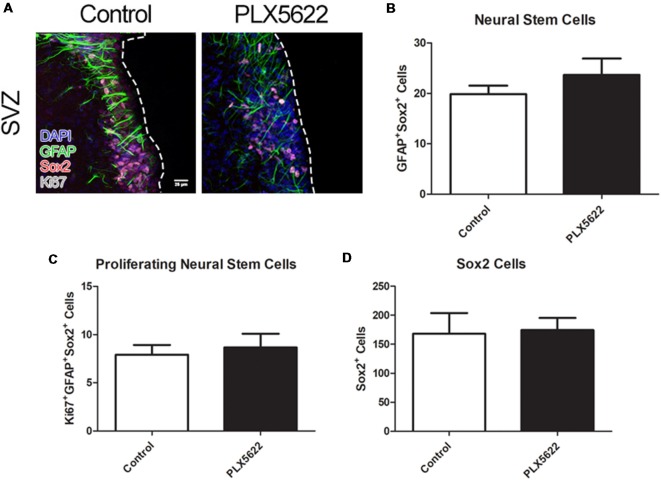
Figure 2.
No change in neural stem cell (NSC) or TAC population from PLX5622 treatment. Representative images of the SVZ from 14d of PLX5622 treatment (A), with the dashed line separating the SVZ from the lateral ventricle. DAPI in blue, glial fibrillary acidic protein (GFAP) in green, Sox2 in red, and Ki67 in gray. Quantification of NSC population shown in (B, p = 0.2465), with proliferating (Ki67+) NSCs shown in (C, p = 0.6871). Sox2+ cells, which includes NSCs and TACs, is shown in (D, p = 0.8964). n = 6 for all groups, two sections per n, plotted as per SVZ wall.

