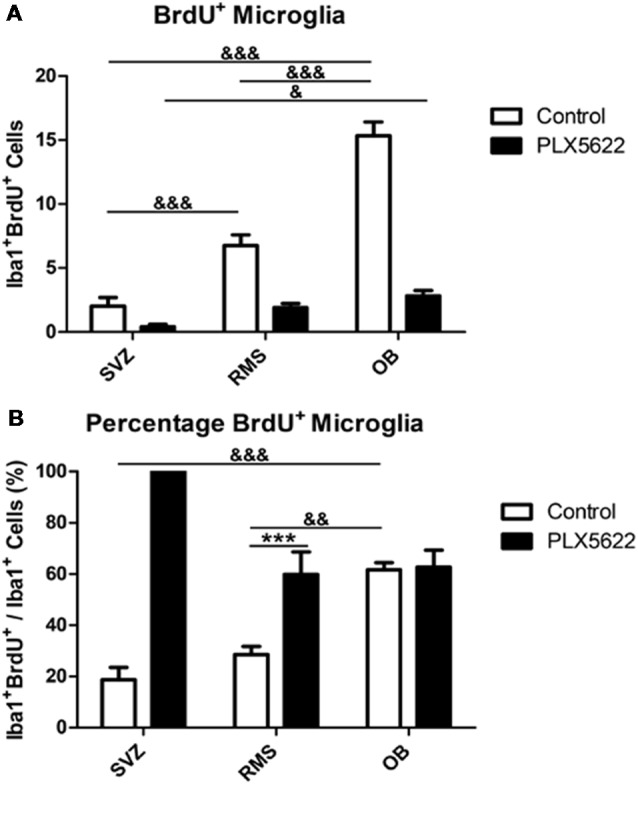
Figure 4.

Remaining microglia have no change in rate of replication after PLX5622 treatment. BrdU+Iba1+ cells were quantified (A, F(2,15) = 30.39, p < 0.0001) and normalized in (B, F(2,15) = 51.75, p < 0.0001). The OB contained more BrdU+ microglia than the RMS and SVZ in control mice, but only more than the SVZ in PLX5622 treated mice. When normalized, control OBs had a higher percentage of BrdU+ microglia compared to the RMS and SVZ, with no significant difference between control and PLX5622 treated mice. & = comparison between regions within treatment, * = comparison between treatments within a region. */& = p < 0.5; **/&& = p < 0.01; ***/&&& = p < 0.001. n = 6 for all groups, two sections per n. Microglia in (A) plotted as an average per section generated by sum of field of views.
