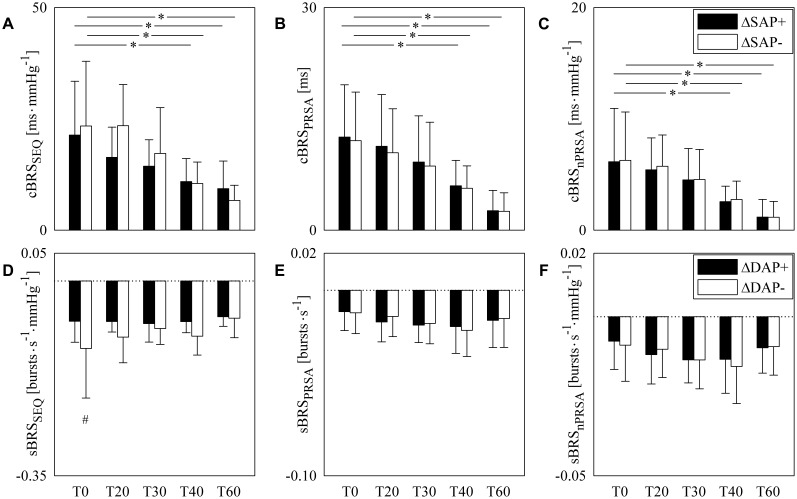
FIGURE 2.
The grouped error bar graphs show cBRS (A–C) and sBRS (D–F) in young healthy subjects undergoing incremental head-up tilt as a function of the experimental condition (i.e., T0, T20, T30, T40, and T60). cBRS and sBRS were estimated using three different approaches, namely SEQ (A,D), PRSA (B,E), and nPRSA (C,F) methods, and reported by separately considering positive (black bars) and negative (white bars) SAP variations in (A–C) and DAP changes in (D–F). The results are presented as mean plus standard deviation. The symbol # indicates a significant change of cBRS (A–C), or sBRS (D–F), versus positive AP variations with p < 0.05 within the same experimental condition (i.e., T0, T20, T30, T40, or T60). The symbol ∗ indicates a significant change with p < 0.05 versus T0 within the same type of cBRS (A–C), or sBRS (D–F).

