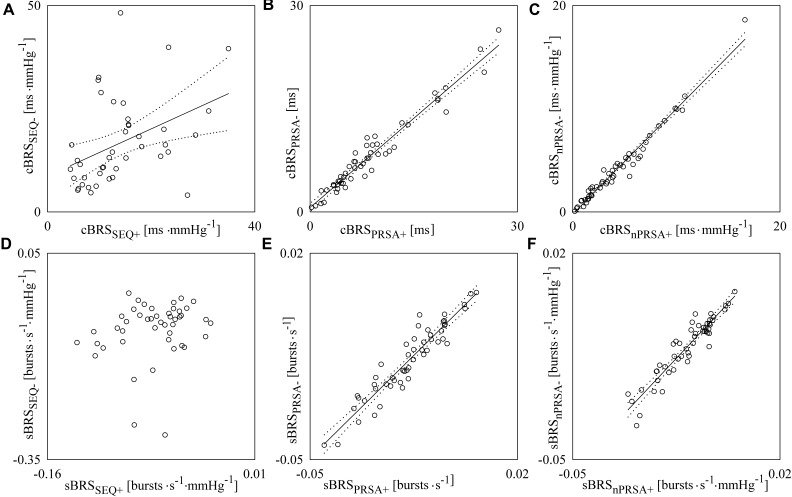
FIGURE 5.
The scatter plots show the results of linear correlation analysis in the planes (cBRSSEQ+, cBRSSEQ-) (A), (cBRSPRSA+, cBRSPRSA-) (B) and (cBRSnPRSA+, cBRSnPRSA-) (C), (sBRSSEQ+, sBRSSEQ-) (D), (sBRSPRSA+, sBRSPRSA-) (E), and (sBRSnPRSA+, sBRSnPRSA-) (F) in young healthy subjects undergoing incremental head-up tilt. Each circle represents the pair of cBRS (A–C) or sBRS (D–F) estimates computed in a subject in a given experimental condition. Data were pooled together regardless of the experimental condition (i.e., T0, T20, T30, T40, and T60). The linear regression line (solid line) and its 95% confidence interval (dotted lines) are plotted only if the Pearson correlation coefficient is significantly different from 0 with p < 0.05.

