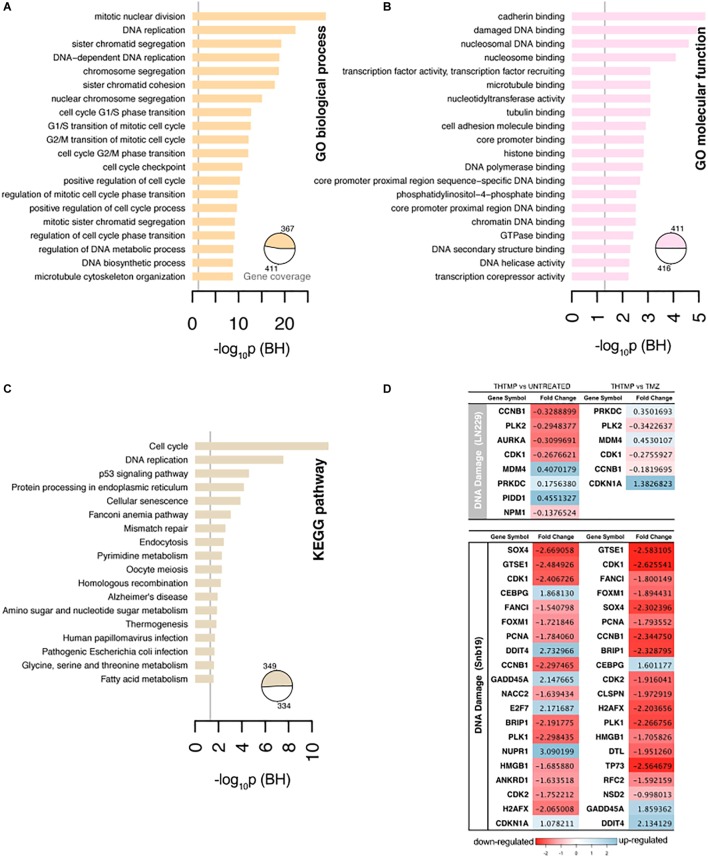
FIGURE 4.
Selected results of Gene Ontology terms and pathways over-representation analysis (FDR < 0.01) on the top 20 terms. (A) Overrepresented Gene Ontology (GO) Biological process terms. (B) Overrepresented GO Molecular function terms. (C) Overrepresented KEGG pathway terms. The x-axis contains the number of genes involved in a particular pathway that were found differentially expressed in our study. The pie charts indicate the fraction of the signature genes associated with significantly enriched terms. The number of genes were normalized to allow comparisons between groups within the same cell line, and the vertical line on the pathways corresponds to the significant p-values. (D) The top 20 DEGs which are involved in the DNA damage on LN229 and Snb19. The DEGs were color coded, with the colors corresponding to the up- and down- expressed.

