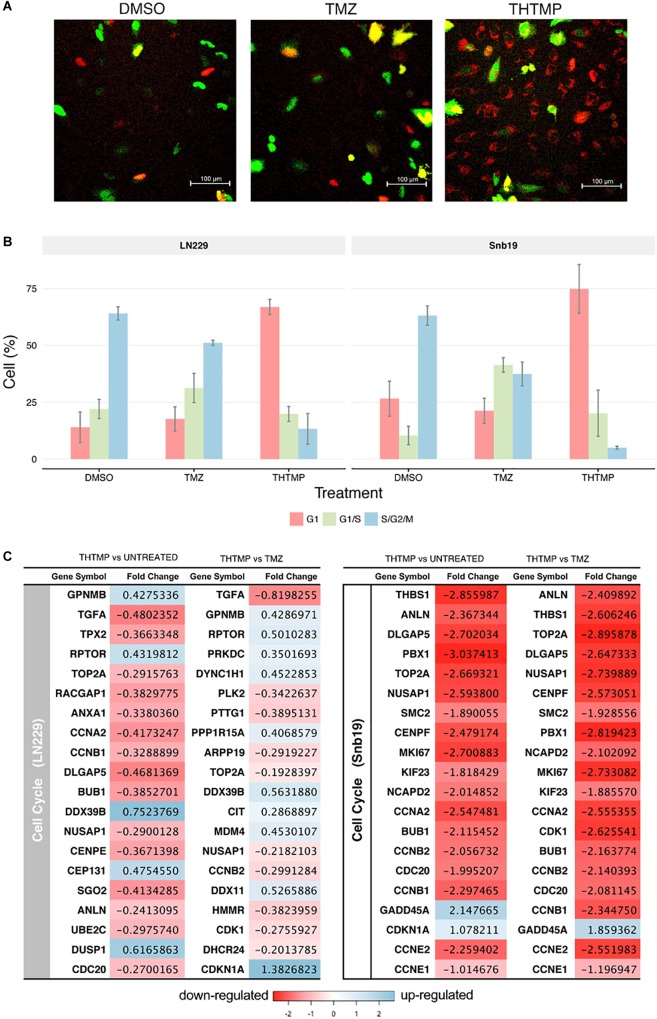
FIGURE 5.
Cell cycle analysis using FUCCI and RNA-seq. (A) Demonstrated images of cell which were dyed with FUCCI in different conditions (DMSO, TMZ, and THTMP). Red cells corresponding to the cells in G1, yellow cells corresponding to the cells in G1/S phase and the green cells corresponding to the cells in S/G2/M phase (B) Percentage of total cell in different phases when they were treated with THTMP and TMZ. (C) The top 20 DEGs which are involved in the cell cycle on LN229 and Snb19. The DEGs were color coded, with the colors corresponding to the up- and down- expressed.

