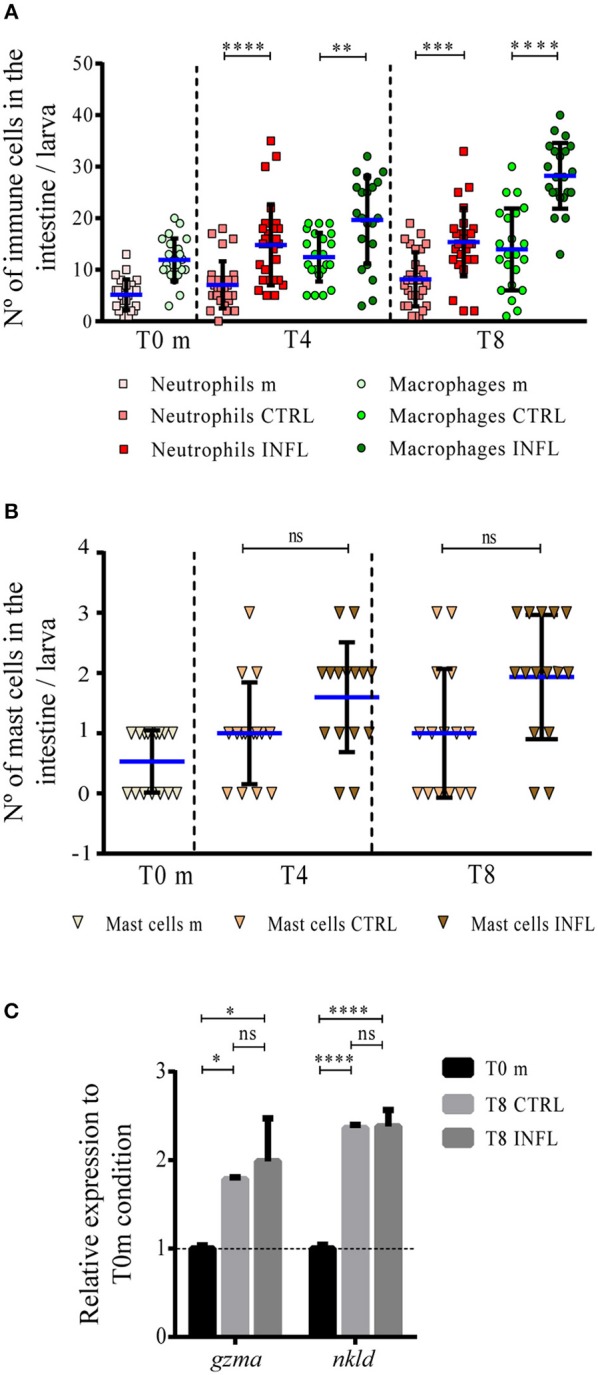
Figure 2.

Neutrophils and macrophages increase in number in the gut during the inflammation process triggered in the developed feeding model. The number of neutrophils/macrophages (A), and mast cells (B) was quantified under the different conditions (m, maintenance; CTRL, control; INFL, inflammation) and time points (T0m: 18 dpf; T4: 21 dpf; T8: 25 dpf). (C) Relative mRNA levels of gzma and nkld were analyzed. Data were normalized against rpl13a and compared to T0 maintenance condition (dotted line). **p < 0.01; ***p < 0.001; ****p < 0.0001. Experiments were done at least in three biological replicates with 20 individuals per condition.
