Figure 2.

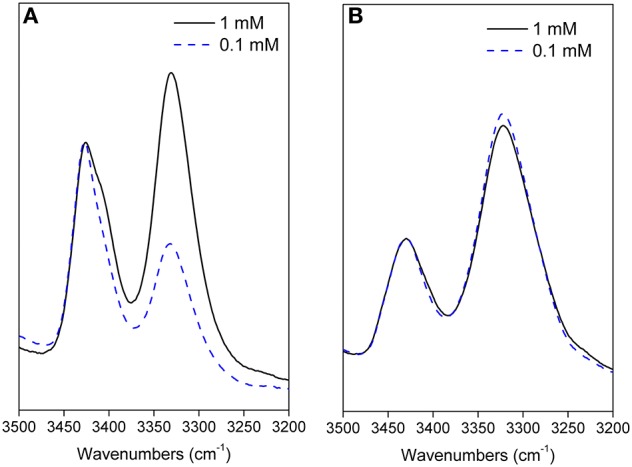
Amide A portion of the FTIR spectra acquired for 11 (A) and 12 (B) in CDCl3 solution at 0.1 and 1 mM peptide concentrations (cell path lengths of 10 and 1 mm were used, respectively).

Amide A portion of the FTIR spectra acquired for 11 (A) and 12 (B) in CDCl3 solution at 0.1 and 1 mM peptide concentrations (cell path lengths of 10 and 1 mm were used, respectively).