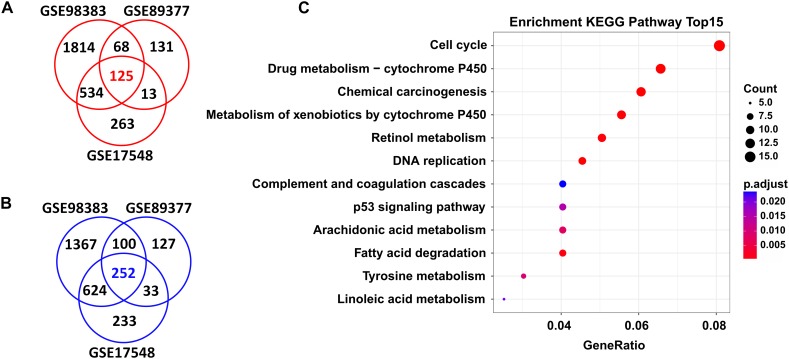
FIGURE 2.
DEGs shared in three independent microarray datasets and their potential functions. A total of 125 upregulated genes (A) and 252 downregulated genes (B) were shared between the GSE98383, GSE89377, and GSE17548 datasets when comparing HCC to cirrhosis subjects. Red indicates upregulation and blue represents downregulation. DEGs were determined using GEO2R software. FDR < 0.05 and FC > 1.5 were considered as the cutoff values. (C) Significantly enriched KEGG pathways of the total shared DEGs. ClusterProfiler package was selected to perform KEGG pathway enrichment analysis. Adjusted P-values of <0.05 were considered statistically significant.

