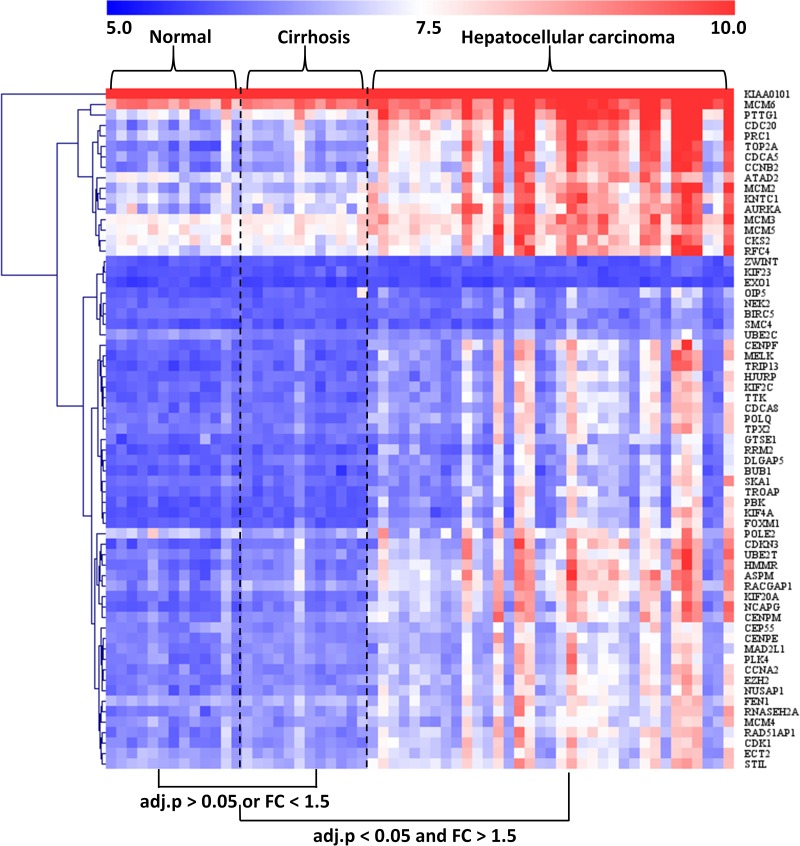
FIGURE 5.
Heatmap of modular gene expression in normal, cirrhotic, and HCC livers. GSE89377 dataset contained 13, 12, and 35 normal, cirrhosis, and HCC subjects, respectively. Modular gene expression in GSE89377 was normalized by antilog-transformed RMA value. Heatmap of modular gene expression was generated by MeV software. Differential gene expression analysis between the two groups was performed using GEO2R. FC represents fold-change. Red indicates high expression and blue signifies low expression.

