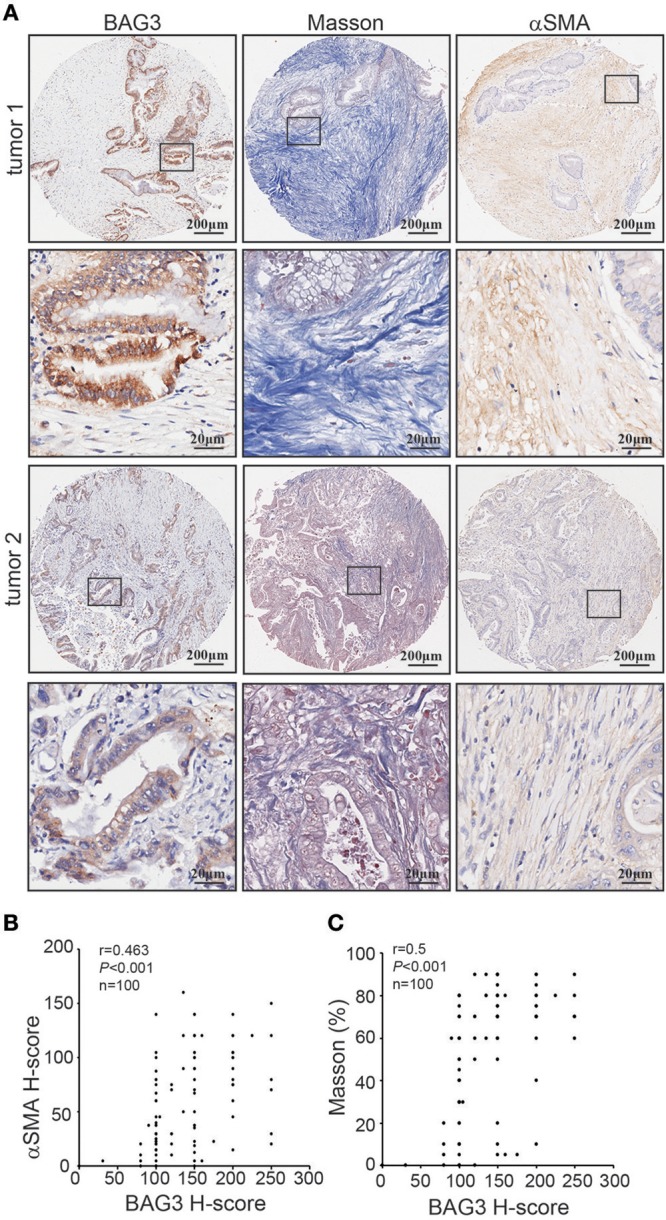
Figure 2.

Correlation of BAG3 and fibrosis in pancreatic cancer tissues. (A) Representative immunohistochemistry staining with BAG3, αSMA, as well as Masson staining in pancreatic cancer tissues. (B,C) Scatter plots showing the positive correlation between BAG3 and αSMA (B) or Masson (C) IHC score in pancreatic cancer tissues. Pearson's coefficient tests were performed to assess statistical significance.
