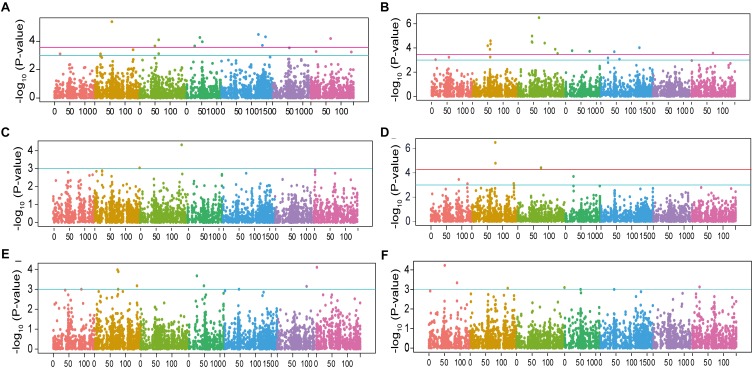
FIGURE 3.
Manhattan plots for SNP association analysis of barley root traits. Negative Iog10-transformed P-values from genome-wide association scan were plotted against positions on each of the seven chromosomes of barley. Chromosomes are depicted in different colors (Chr 1H to Chr 7H, from left to right). The red and light-blue horizontal lines correspond to significance threshold FDR <0.1 and -Iog10 P-value >3, respectively. (A) Root system depth; (B) root spreading angle; (C) seminal root number; (D) total seminal root length; (E) average seminal root length, and (F) shoot dry weight.

