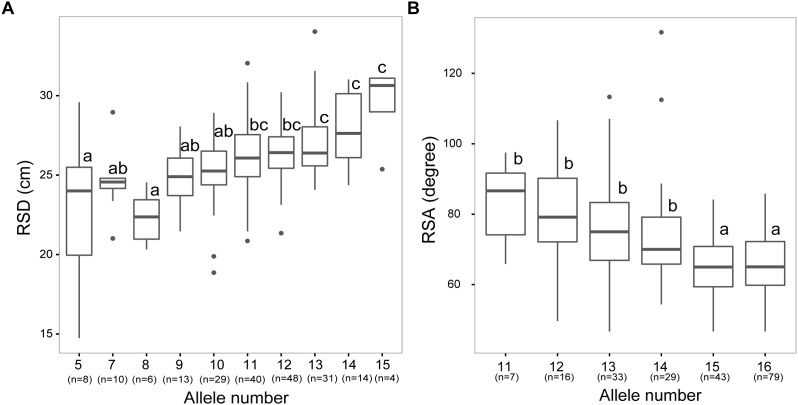
FIGURE 5.
Combined allelic analysis reveals additive effects of root alleles. (A,B) Boxplot for trait values of genotypes with different number of alleles associated with longer root system depth (RSD; A) or narrower root spreading angle (RSA; B). X-axis indicates the number of alleles carried by accessions, while numbers in brackets represent the number of genotypes in each group. Different letters indicate significant differences at P < 0.05 according to one-way ANOVA and post-hoc Tukey test.

