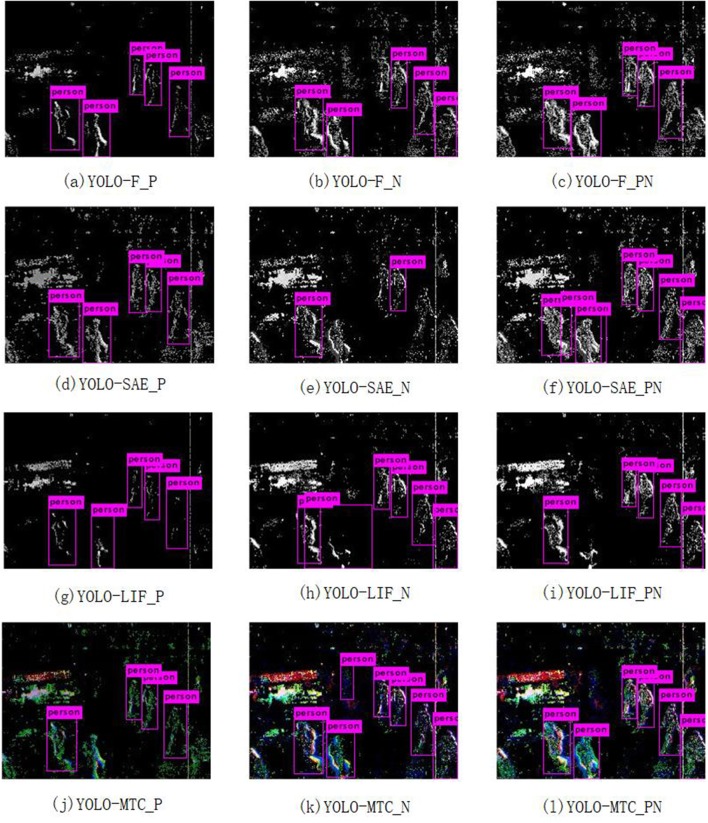
Figure 6.
Predicted results: The outputs from three individual detectors (YOLO-F, YOLO-SAE and YOLO-LIF) are shown in the upper three rows while outputs from YOLO-MTC are shown in the lower row. Meanwhile, the results of the same Positive-Negative combination dataset are shown in the same column. (A) YOLO-F_P; (B) YOLO-F_N; (C) YOLO-F_PN; (D) YOLO-SAE_P; (E) YOLO-SAE_N; (F) YOLO-SAE_PN; (G) YOLO-LIF_P; (H) YOLO-LIF_N; (I) YOLO-LIF_PN; (J) YOLO-MTC_P; (K) YOLO-MTC_N; (L) YOLO-MTC-PN.

