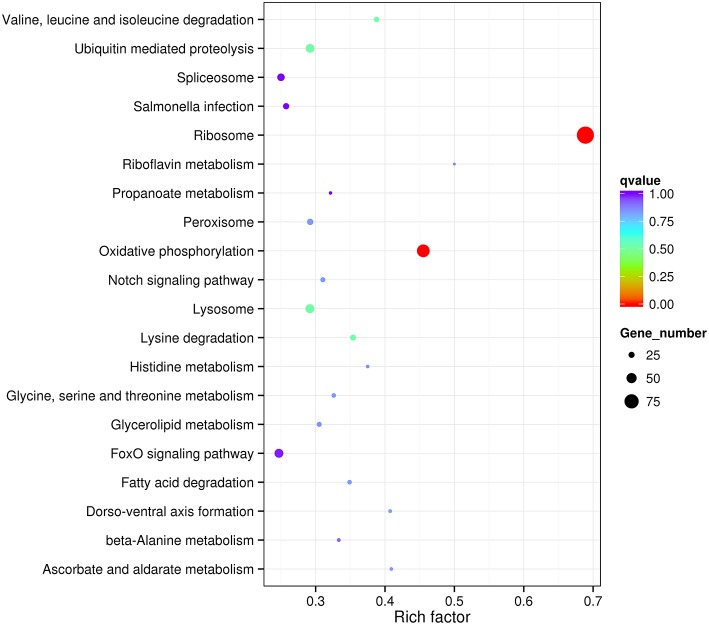
Figure 8.
Statistics of KEGG pathway enrichment for differentially expressed mRNA in lncRNA-mRNA co-expression analysis for D/E-1.46 vs. D/E-0.61. Rich factor is the ratio of number of differentially expressed genes in a certain pathway to number of all annotated genes in this pathway. qvalue is corrected P-value by multiple hypothesis test. q-value < 0.05 denotes significant differences.

