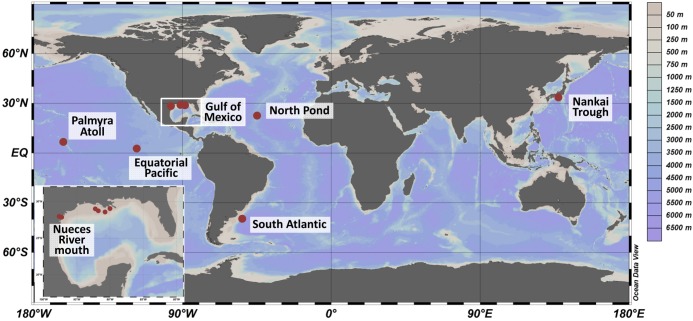
FIGURE 1.
Sampling sites worldwide (large panel) and in the Gulf of Mexico (small panel). Sediments were collected from 2007 to 2012 during several expeditions. The color scale represents water depths at the various sites. The map was created using OceanDataView (Schlitzer, 2018).

