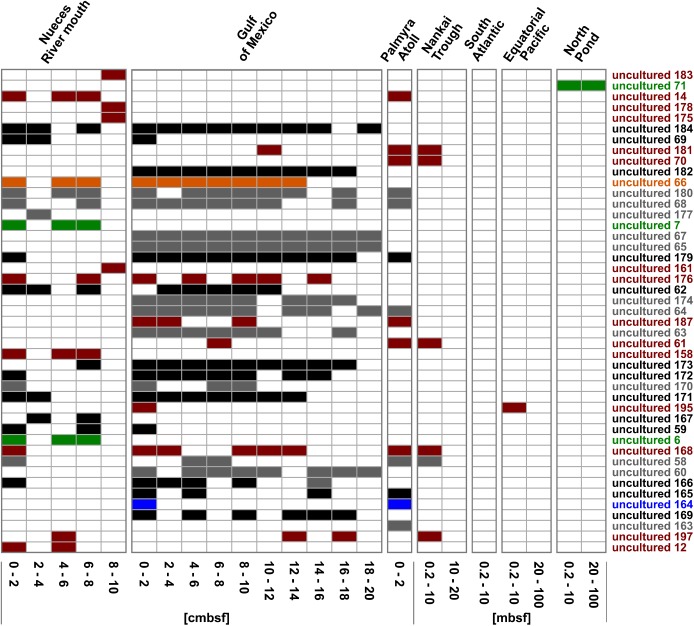
FIGURE 6.
Distribution of the OTUs affiliated to uncultured representatives within the Rhodobacteraceae. OTUs are sorted by their relative abundance on the total bacterial community. Sample locations are arranged by water depth and then by sediment depth. The affiliation of OTUs to the phylogenetic subgroups is displayed by red = Roseobacter, orange = Stappia, green = Amaricoccus, black = cluster I, gray = cluster II, and blue = unclear assignment.

