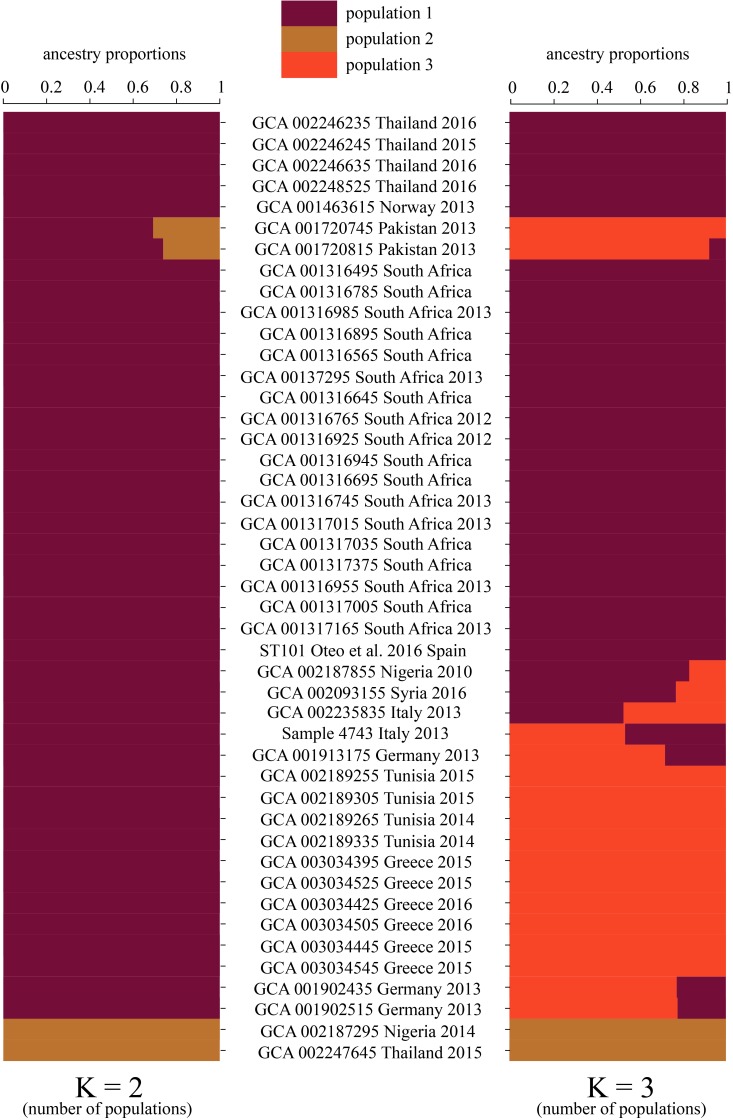
FIGURE 2.
Ancestry proportions were inferred for the ST101 lineage using fastStructure v1.0 with the optimal choices of K (populations). Two different K-values (number of populations) were selected as most appropriate, K = 2 and K = 3. K = 2 graph represents two populations with little shared ancestry between them. Population one is represented by dark red. Population two is distinguished as brown. When running fastStructure with the number of expected populations set at three (K = 3), we observed limited shared ancestry.

