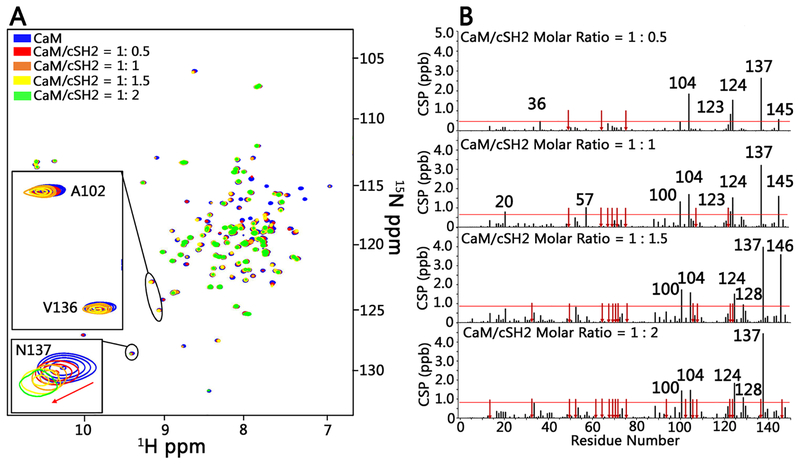
Figure 4.
NMR titration of [15N]CaM with cSH2 shows effects of binding on chemical shifts and signal line widths. (A) Superimposition of 15N HSQC spectra of CaM (100 μM) in the absence of unlabeled cSH2 (blue) and in the presence of unlabeled cSH2 at molar ratios of 1:0.5 (red), 1:1 (orange), 1:1.5 (yellow), and 1:2 (green) (CaM:cSH2). Signal disappearances for CaM Ala102 and Val136 at a 1:2 molar ratio (CaM–cSH2) are shown in spectral insets. The red arrows mark the direction of chemical shift changes of CaM Asn137. (B) Normalized HN chemical shift perturbations at molar ratios (CaM–cSH2) from 1:0.5 to 1:2. The red arrows represent the disappearance of resonances in CaM due to binding cSH2, and the horizontal line marks the average value of chemical shift perturbations plus one standard deviation.

