Figure 4.

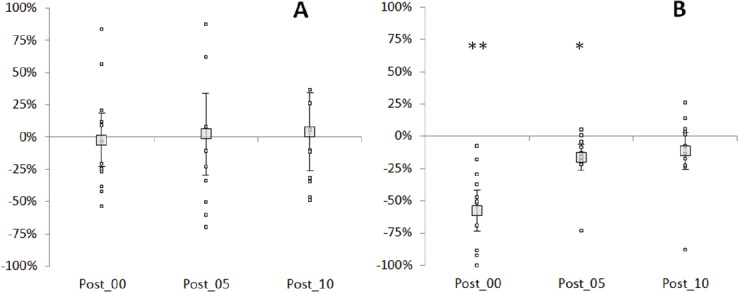
T-reflex variation. Percentage of variation pre-post control (A) and pre-post stretching (B) for each time point after intervention for individual subjects (small markers) and the group mean ± SD (large markers). **=P<.01; *=P<.05.

T-reflex variation. Percentage of variation pre-post control (A) and pre-post stretching (B) for each time point after intervention for individual subjects (small markers) and the group mean ± SD (large markers). **=P<.01; *=P<.05.