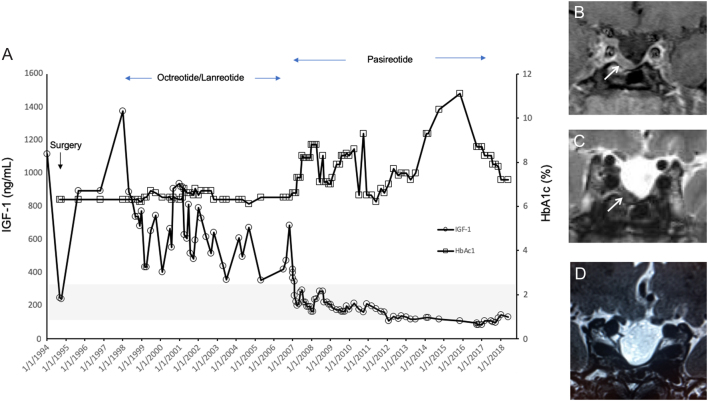
Figure 2.
Panel A shows hormonal responses over 24 years from diagnosis to last follow-up in November 2018 in Patient 1. IGF-1 and HbA1c levels are shown in response to octreotide/lanreotide depots and then with pasireotide LAR beginning in 2006, until withdrawn 18 months ago. The normal range for IGF-1 is outlined in grey in the lower part of the graph. The postoperative tumor residue is shown in panel B (arrow) and the shrinkage of the tumor in panel C after about five years of pasireotide therapy. Panel D shows the MRI after >12 months off all somatostatin analogs.

 This work is licensed under a