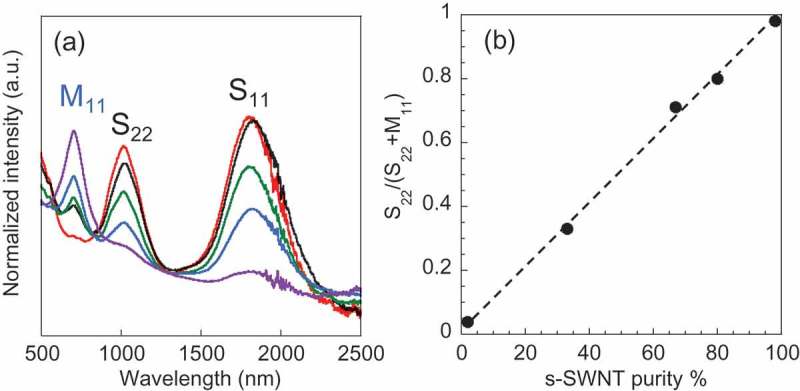
Figure 2.

(a) UV-vis-NIR absorption spectra of s-SWNT dispersions with various s-SWNT purities: 98% (red), 80% (black), 67% (green), 33% (blue), and 2% (purple). (b) The S22 absorption peak area as a proportion of total peak area (S22+M11) as a function of the s-SWNT purity. The dotted lines was added as eye guide.
