Figure 4.

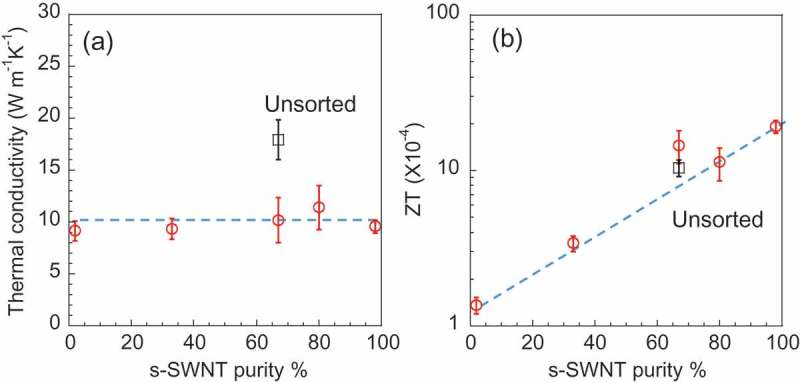
In-plane (a) thermal conductivity and (b) ZT of s-SWNT sheets as a function of the s-SWNT purity (red circles). The TE values of the unsorted SWNT sheet are also plotted (black squares). The blue dotted lines were added as eye guide.

In-plane (a) thermal conductivity and (b) ZT of s-SWNT sheets as a function of the s-SWNT purity (red circles). The TE values of the unsorted SWNT sheet are also plotted (black squares). The blue dotted lines were added as eye guide.