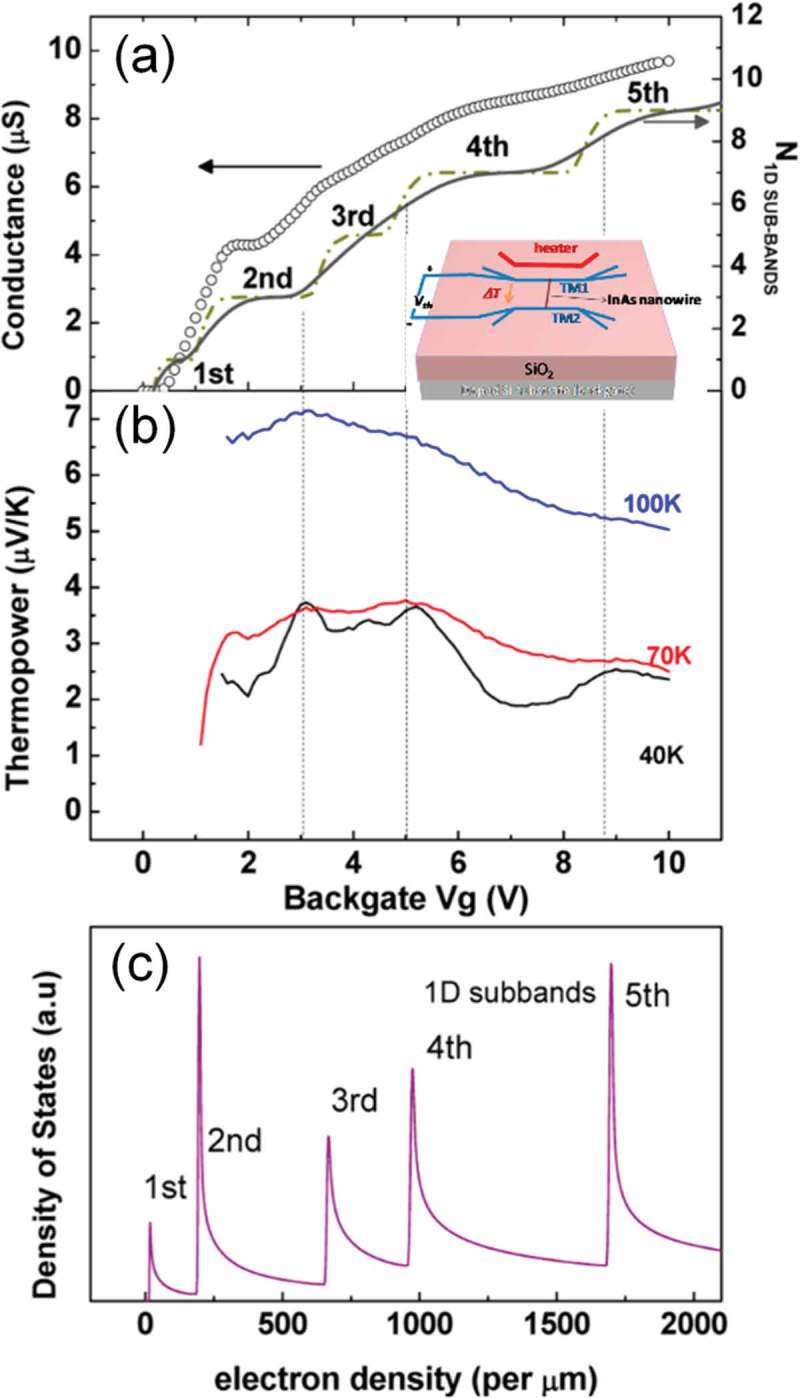
Figure 15.

Gate-tuned conductance and thermopower of InAs nanowire. (a) Comparing the measured conductance (40 K) vs gate voltage (Vg) data (open circle) with the calculated one dimensional (1D) subband occupation with only thermal broadening (dash dotted line) or both the thermal and the scattering broadening (solid line) considered. (b) Gate modulation of thermopower (S) at 100, 70, and 40 K. The dashed vertical lines are a guide to the eye, highlighting the appearance of peak in S(Vg) when a 1D subband starts to be filled. (c) Calculated density of states vs 1D electron density in nanowire with the index of subbands marked. Reproduced with permissions from [135].
