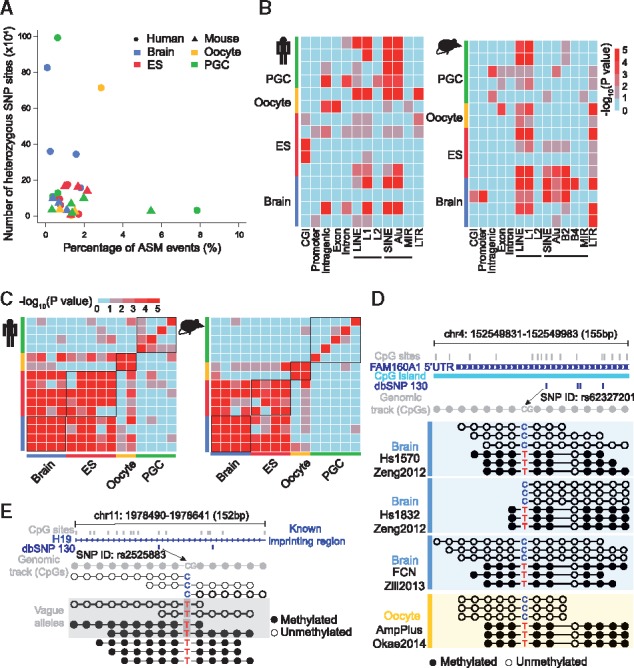
Fig. 2.

Allele-specific DNA methylation in humans and mice. (A) Scatter plot showing the percentage of ASM events and the number of heterozygous SNVs defined in both human and mouse samples. Round dots represent human samples and triangles represent mouse samples. (B) Enrichment analysis of ASM events in genomic elements showing different genomic bias within species. Colours indicate significance levels of enrichment by the hypergeometric test. (C) Heatmap showing the consistency of ASM among cell-types in both human (left panel) and mouse (right panel). Colours indicate significance level of consistency from low to high using the hypergeometric test. (D) Representative locus of ASM linked by a known SNP site in dbSNP130 located at 5’ UTR of FAM160A and in a CpG island. Reads linked by two heterozygous alleles were representatively selected in the Tanghulu plot for three brain samples and one oocyte sample. (E) Representative ASM locus linked by a heterozygous SNV site with C to T transition disrupting the CpG context of one allele, which is located in a known imprinting gene, H19. Reads linked by T, identified with a grey rectangular background, were ambiguous reads that could not be assigned to allele C or T due to bisulfite conversion. Open circles, unmethylated CpG sites; filled circles, methylated CpG sites
