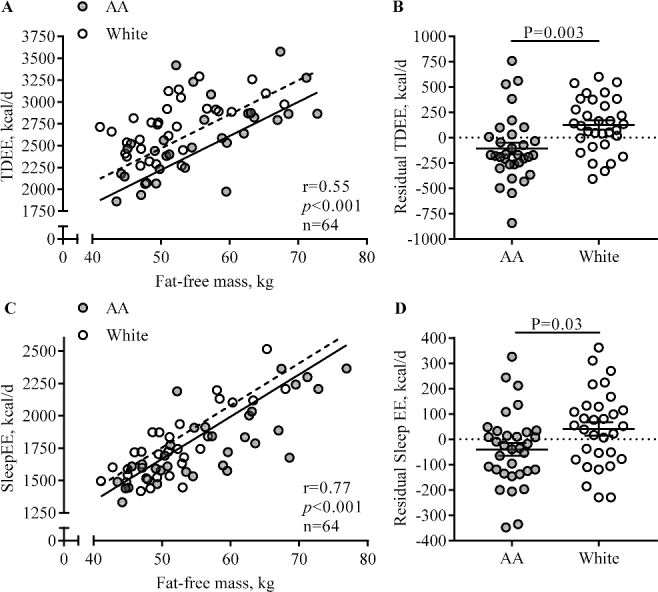
FIGURE 2.

Comparison of EE adjusted for body composition between AA and white pregnant women with obesity. Each data point represents 1 participant, and the lines are means ± SEMs. Residual EE reflects the difference between the EE predicted from a regression equation and EE that was measured. Correlations between fat-free mass and energy expenditure (A: TDEE; C: SleepEE) and the associated regression lines are shown for AA (TDEE: n=32; SleepEE: n=33; filled circles, straight lines) and white (TDEE: n=32; SleepEE: n=31; open circles, dotted lines) women separately, because for both TDEE and SleepEE, we observed a main effect for race and no race × FFM interaction. The main effect for race on TDEE (B) and SleepEE (D) is represented as residual EE, which reflects the difference between the EE predicted from a regression equation (EE as dependent of fat-free mass and fat mass) and measured EE. AA, African American; EE, energy expenditure; SleepEE, sleeping energy expenditure; TDEE, total daily energy expenditure.
