
Figure 5.
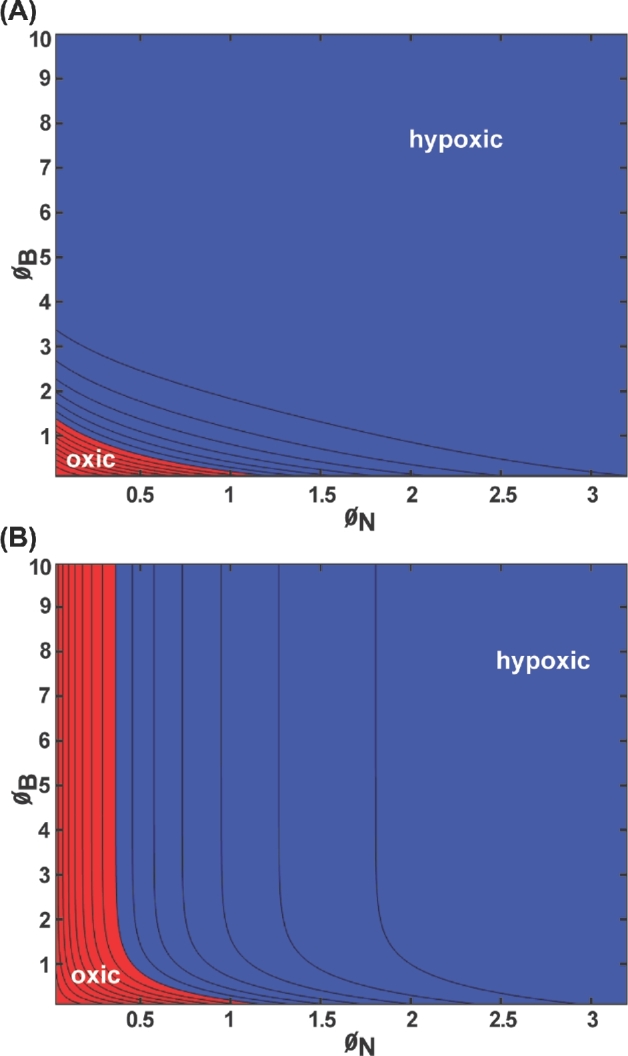
Oxygen concentration within the biofilm layer for slab geometry bounded by an implant and host tissue presented as a contour plot: (A) minimum concentration within the biofilm; (B) concentration at the biofilm–neutrophil interface. Blue denotes values corresponding to hypoxia (less than 10 mm Hg oxygen); red denotes values that are oxic (greater than or equal to 10 mm Hg oxygen). Parameter values: CA = 200 μM = 127.6 mm Hg, CH = 40 μM = 25.5 mm Hg, kN = 0.01 s−1, kB = 0.1 s−1, DN = 1000 μm2 s−1, DB = 1000 μm2 s−1, hN ranging from 10 to 1000 μm, hB ranging from 10 to 1000 μm.