
Figure 6.
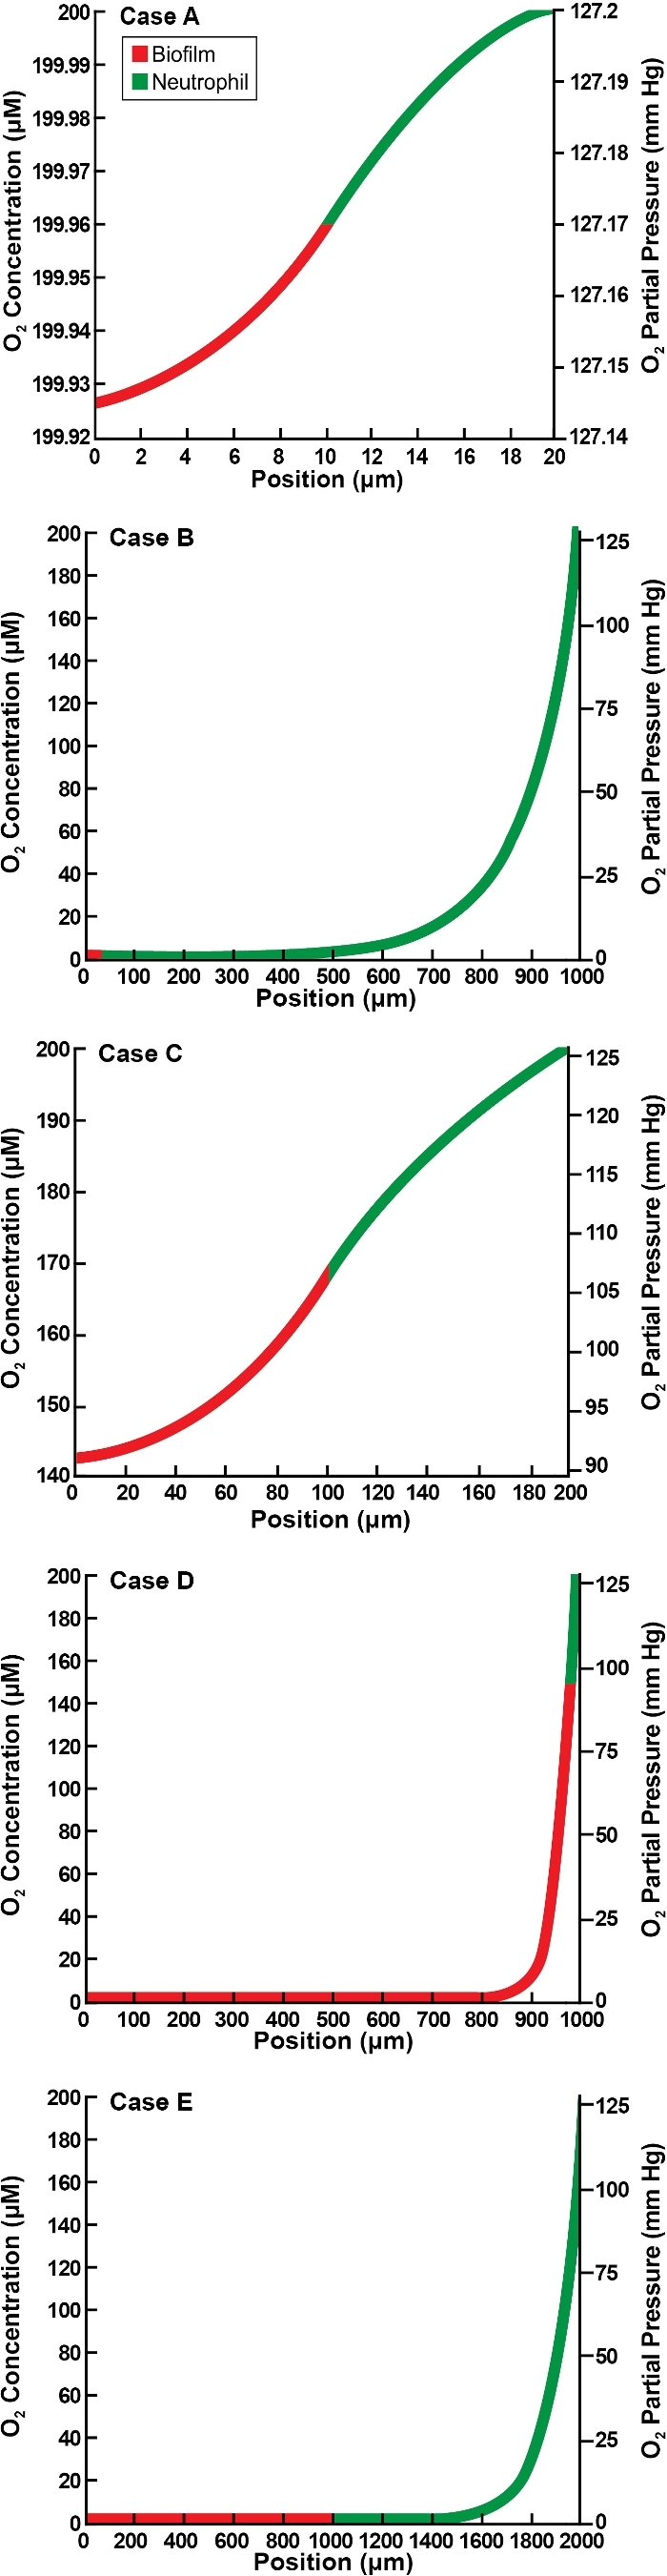
Oxygen concentration profiles in spherical geometry for five illustrative cases as detailed in Table 2. Panels A–E correspond to the lettered cases in the table. Position is the value of spatial variable r.
Official websites use .gov
A
.gov website belongs to an official
government organization in the United States.
Secure .gov websites use HTTPS
A lock (
) or https:// means you've safely
connected to the .gov website. Share sensitive
information only on official, secure websites.
Oxygen concentration profiles in spherical geometry for five illustrative cases as detailed in Table 2. Panels A–E correspond to the lettered cases in the table. Position is the value of spatial variable r.