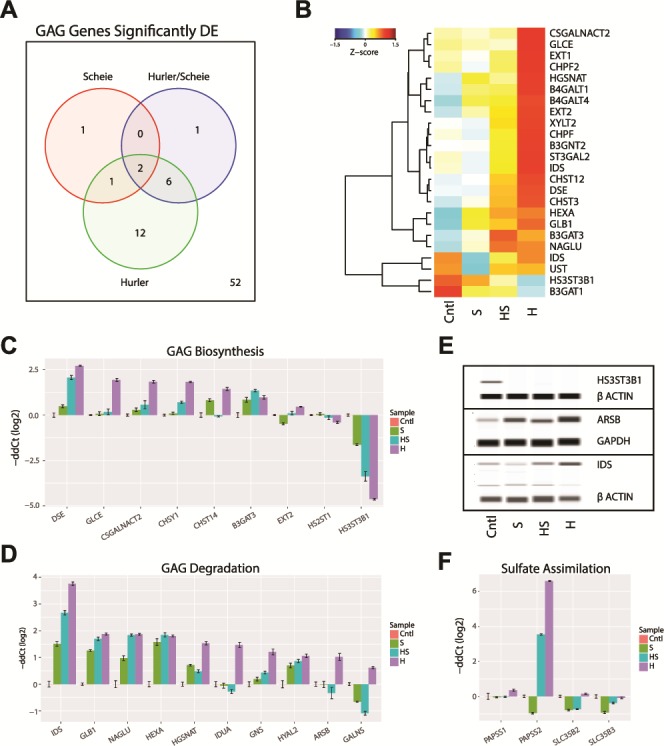
Figure 4.

GAG dysregulation in MPS I. (A) GAG biosynthesis and degradation genes from REACTOME pathways (R-HSA-2022928 and R-HSA-2024096) significantly differentially expressed (DE) in the MPS I isotypes. Genes had a >2-fold change and <1% FDR when compared to control samples. (B) The significantly DE GAG gene changes in expression are shown as a heatmap. The Z-score of the gene expression is shown. (C and D) Validation of GAG biosynthesis and degradation genes by qRT-PCR. (E) Immunoblot validation of selected GAG genes. (F) Validation of GAG sulfate assimilation genes by qRT-PCR.
