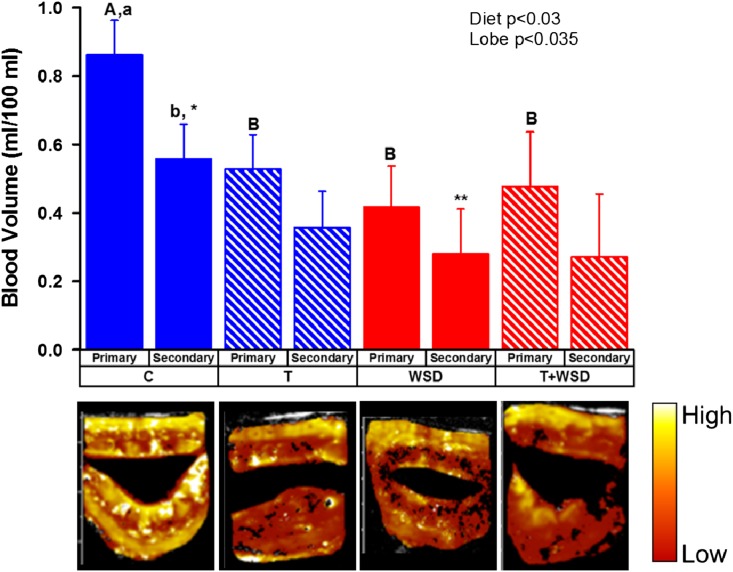
Figure 2.
Placental blood volume (BV) in forming placenta at ~GD30. Primary and secondary lobes were identified by fill characteristics. False-colored representative images from each treatment group are depicted under chart. Diet and lobe effects were determined by mixed-model analyses and are included as text inserts within the graph. Different uppercase letters indicate significant differences between treatment groups (P < 0.05, C vs T + WSD P = 0.05), while lower case letters indicate differences between lobes (P < 0.05). Asterisks denote trend between secondary lobe of C and WSD groups (P = 0.10).

