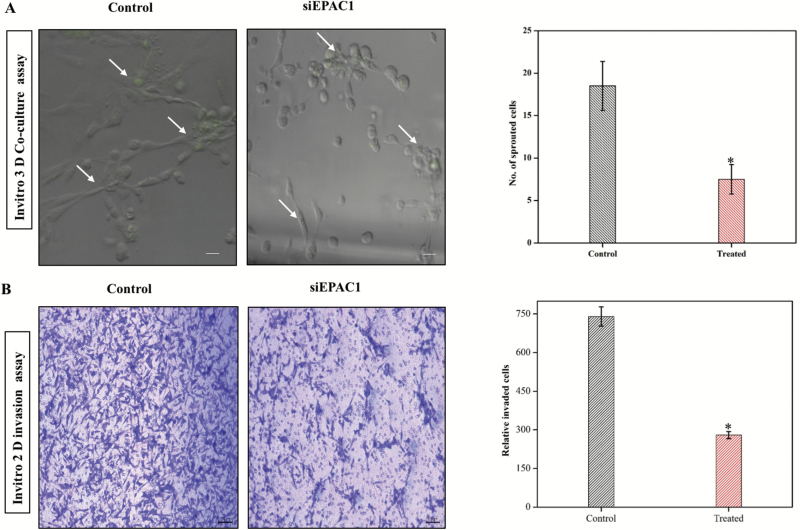
Figure 2.
Down regulation of EPAC1 reduces Invasion and sprouting in a 3D co-culture model. (A) Representative image showing the sprouting assay, which was tested in co-culture of HUVEC and MDA-MB-231 in the presence or absence of EPAC1 (siRNA) (*P < 0.05). MDA-MB-231 cells were stained by CFSE dye to differentiate between cell lines (green signal). Right panel shows quantification (*P < 0.05, N = 3). (B) Representative images from transwell migration assay show siRNA transfected cells were analyzed for their invasive properties by Transwell migration assay. Right panel shows number of invading cells determined by visual quantification (*P < 0.05, N = 3).

