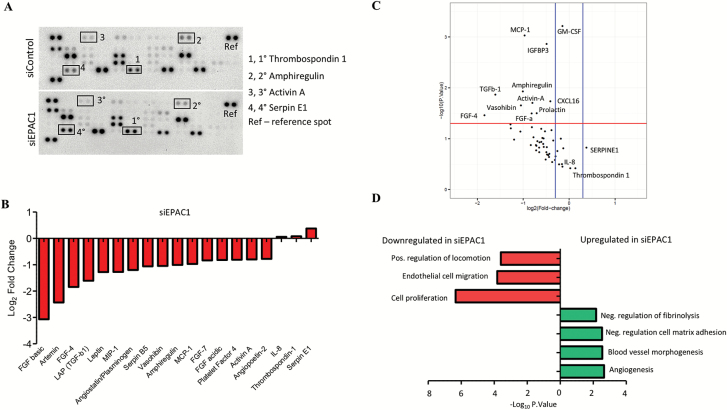
Figure 3.
Angiogenic proteome profiling of tissue culture media (TCM). (A) Representative image of proteome array. (B) Waterfall plot shows Log2 fold change in the optical density of protein spots as quantified using ImageJ software (siEPAC1 vs. scrambled control). (C) Volcano plot shows the proteins that are statistically significantly upregulated by a log2 fold change of 0.1 or higher (blue bars). Red bar indicates the cut-off for statistical significance, P < 0.05. (D) Gene ontology networks were constructed using the highest (upper panel) and lowest (lower panel) differentially expressed proteins between EPAC1 and control determined using the STRING consortium open source software, false discovery rate was set P < 0.001. Proteome array was performed in duplicate and biological replicate on two independent occasions (N = 4).

