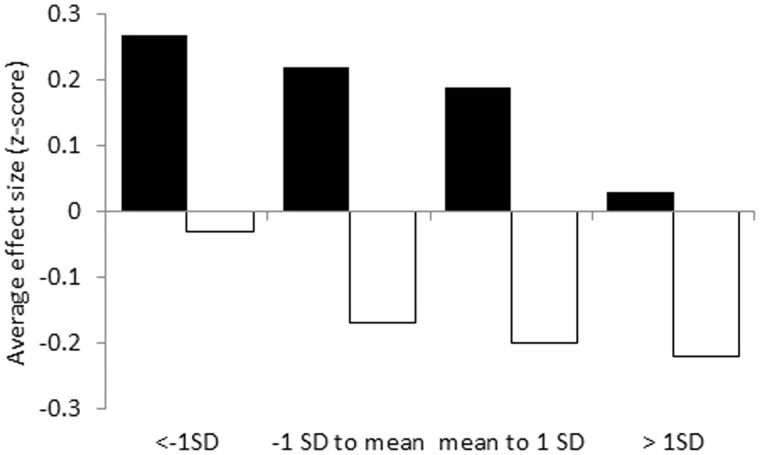
Figure 1.
Exercise intervention effects on physical function (black bars) and fatigue (white bars) during and post cancer treatment, stratified for subgroups based on preintervention standard deviation (SD) score. Results were obtained using linear mixed model analyses with a two-level structure (1: patient, 2: study) to consider the clustering of patients within studies by using a random intercept on study level.

