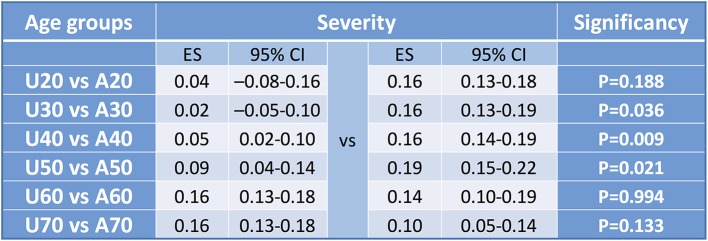
Figure 6.
Forest plot results for cut-off values for severity. Summary table of pooled effect with CI and significance levels to detect cut off value. Concerning mortality all comparisons were significant, however examining severity only three. Explanation might be that in young ages there is a low event rate, in middle age groups there is a higher proportion therefore the difference is equalized leading to a non-significant difference. The same occur in the aged vs. middle aged groups.

