Figure 2.
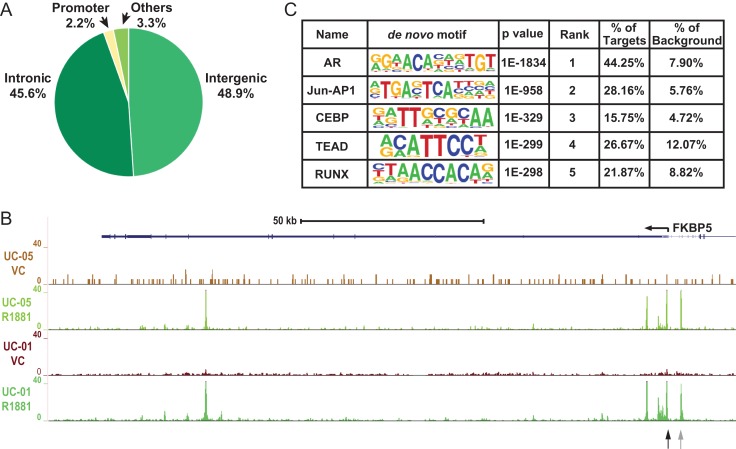
Genome-wide AR binding profile in primary caput HEE cells. (A) Pie chart showing the distribution of AR peaks in various genomic regions. (B) UCSC genome browser graphic showing AR ChIP-seq signals in the FKBP5 locus. Data from two donors (UC-01 and UC-05) with treatment of VC (vehicle control) or R1881 are shown. Black and gray arrows denote sites evaluated for AR occupancy in Fig. 5. (C) The top five enriched motifs near AR peaks identified with Homer de-novo motif analysis. The nucleotide frequencies of the genomic sequences aligned at the motif are shown in a sequence logo representation. The percentages of motif incidence in target and background regions are also shown.

