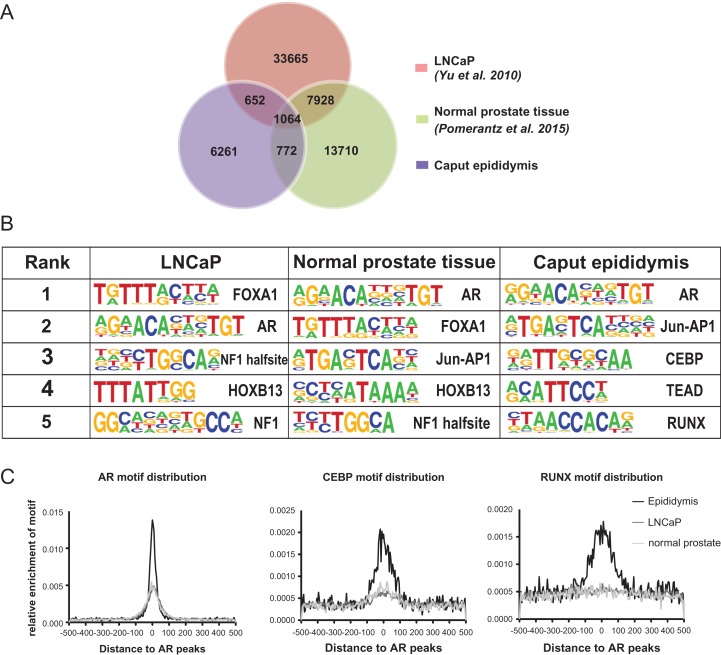
Figure 3.
Epididymis-specific AR cistrome and co-factors. (A) Venn diagram showing the overlap of AR peaks between LNCaP, normal prostate and caput epididymis cells. (B) The top five enriched de-novo motifs identified near AR peaks in different cell types. (C) Quantification of motif enrichment near AR peaks in different cell types. Enrichment of AR, CEBP and RUNX motifs are shown from left to right.

