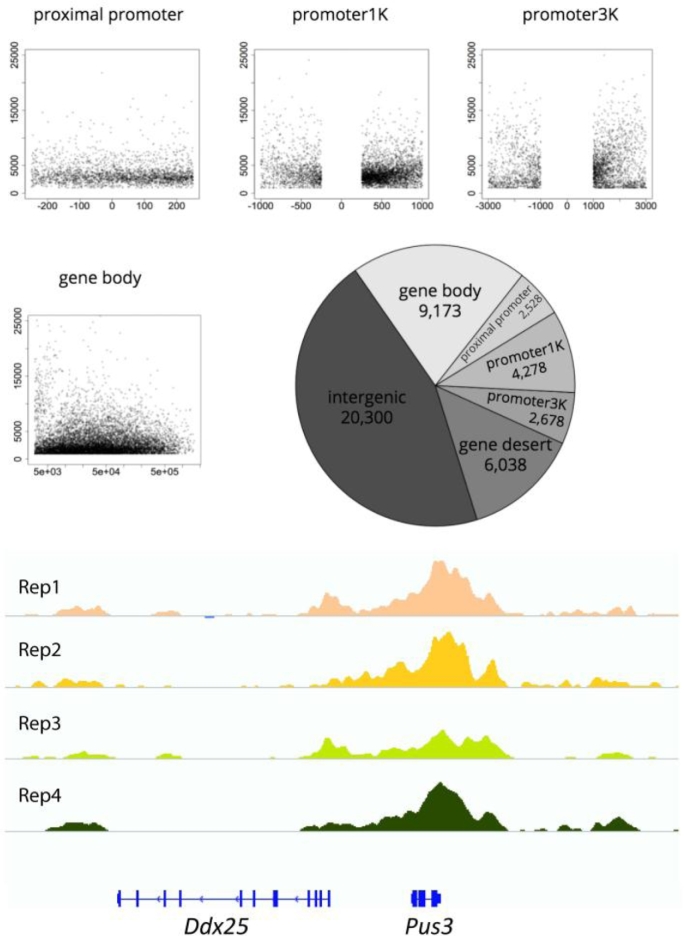
Figure 1.
Size, genomic distribution, and chromosomal profiles of H3K4me2-enriched differential regions. The charts (proximal promoter, promoter1k, promoter3k, and gene body) show the size in kb (y-axis) of H3K4me2-protected sites relative to the TSS (in bp, x-axis). The pie chart shows the distribution of the 44,995 H3K4me2-protected sites by region. The bottom panel shows profiles of the sample replicates of H3K4me2-enriched peaks in the chromosomal region including Ddx25 and Pus3.

