Figure 6.
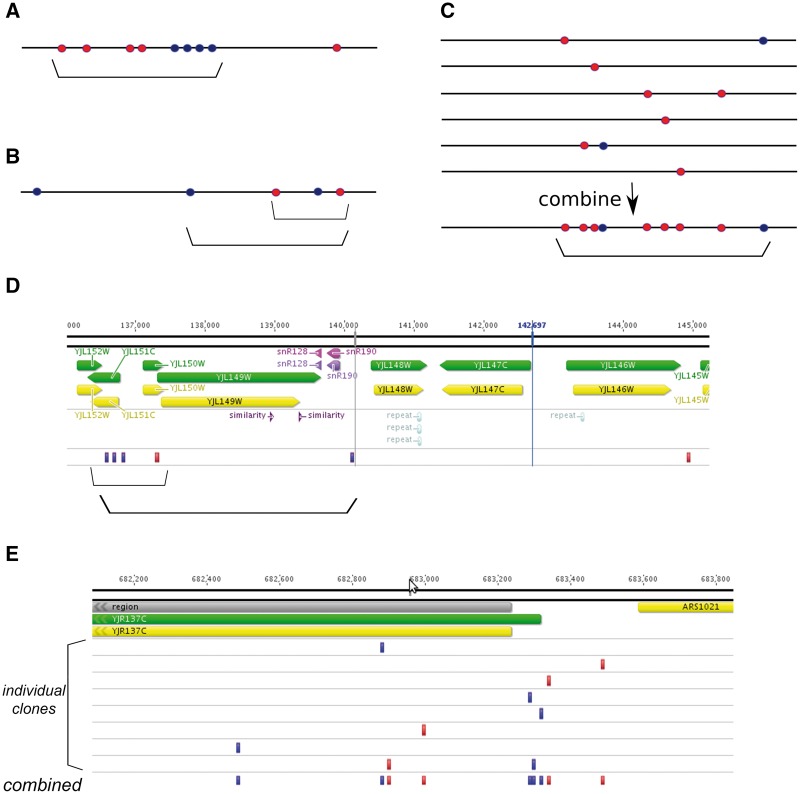
Types of mutational clusters. Horizontal black lines, chromosome. Mutations resulting from damage to the top and bottom DNA strands are shown as lighter (red) and darker (blue) circles, respectively. Clusters are indicated by brackets. (A) Strong, clear cluster resulting from the action of ssDNA-specific mutagen on the resected DNA during DSB repair. (B) Cluster of moderate strength with mixed types of mutations. In this case, clusters of different size can be defined based on the threshold parameters of clustering algorithm (compare two brackets). (C) Six individual clones (e.g. cells, tumors or mutants microorganisms) are shown on top. No apparent clustering is observed except for one clone where two mutations of different types are located close to each other. However, on combining all data sets, prominent and likely strand-specific clustering is detected (bottom). This clustering likely represents the general susceptibility of the corresponding genomic region to the ssDNA-specific mutagen. (D) Example of clustering of intermediate power (compare with scheme on the Panel B). This cluster is found on chromosome X of yeast mutant clone induced by PmCDA1 deaminase [57]. Two clusters can be defined based on the algorithm parameters. Dark (blue) rectangles, heterozygous C >T substitutions, which result from deamination of cytosine in the top DNA strand; lighter (red) rectangles, heterozygous G>A substitutions, which result from deamination of cytosines in the bottom DNA strand. Genomic features, as well as chromosomal coordinates, are shown on top. (E) Example of cluster detected in silico by combining mutational data from independent yeast mutant clones induced by PmCDA1 deaminase. Each individual mutant possesses only a single SNV in this genomic region. However, merging data from several clones reveals a region of susceptibility to the mutagen. Color code and labels are as in the Panel D.

