Figure 2.
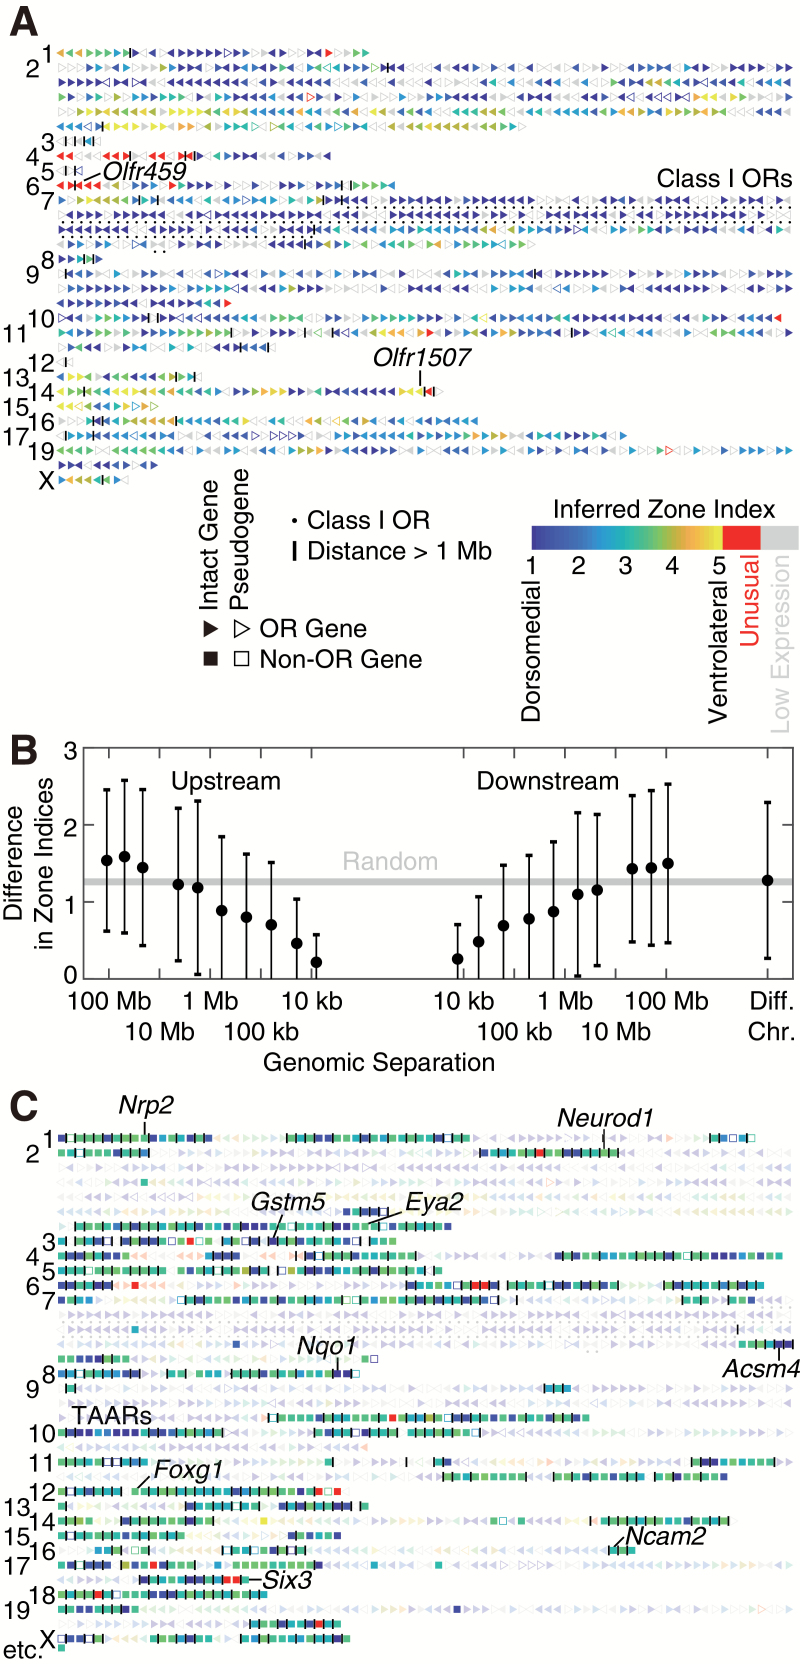
Distribution of zone indices across the mouse genome. (A) Spatial information for all 1417 annotated ORs (triangles, with ▶ denoting the plus strand and ◀ denoting the minus strand). Typically, inferred zone indices vary gradually along the chromosome, although drastic differences between adjacent ORs can be occasionally seen. Numbers on the left denote chromosomes. Grey denotes insufficient detection because of low expression levels. OR clusters are separated by vertical lines. (B) Nearby ORs tend to have similar zone indices. All pairs of ORs from the canonical regions (zone indices between 1 and 5) were grouped into bins according to their log10 genomic separation (in base pairs, upstream or downstream) with a bin size of 0.5. Bins with fewer than 10 OR pairs were excluded. Each black dot denotes the average difference in zone indices and the average log10 genomic separation in each bin. Error bar denotes standard deviation (SD); standard error of the mean (SEM) is smaller than the size of the dot. The gray line (“random”) denotes the expected average difference in zones if ORs are randomly permuted, which equals to the average pairwise difference between all pairs of ORs. (C) Spatial information for 712 non-OR candidates (squares), displayed together with ORs (triangles, faded for visual clarity).

