Figure 2.
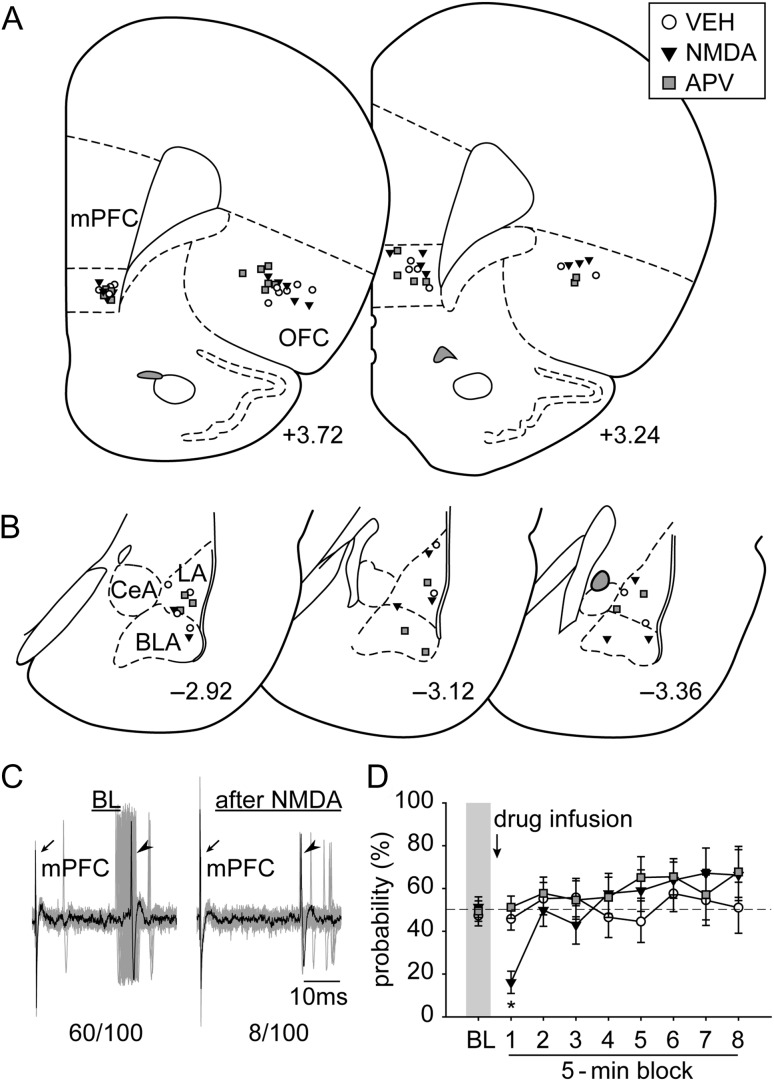
The placements of (A) all the stimulation electrodes in the mPFC and infusion cannulae in the OFC and (B) the distribution of all the neurons recorded (+3.72, +3.24, −2.92, −3.12, and −3.36; AP distance [mm] to bregma). (C) Electrophysiological recording of an amygdala neuron responsive to mPFC stimulation (left) that decreased its evoked responses after OFC pharmacological activation with NMDA (right; n/100 = evoked spikes out of 100 trials). Arrows, electrical stimulation artifacts from mPFC stimulation. Arrowheads, evoked spikes in amygdala. (D) Pharmacological activation of the OFC with NMDA exerted an inhibitory modulation on the mPFC–amygdala pathway (*P < 0.05 relative to VEH and APV). VEH, vehicle. Other abbreviations refer to Figure 1.

