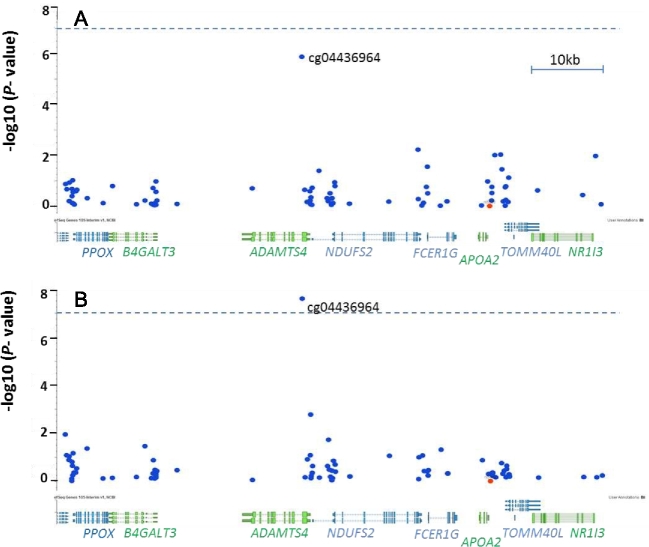
Figure 2.
Close-up of the 81-kb genomic region surrounding the APOA2 −265T >C site (rs5082, the orange dot) of an epigenome-wide association study with APOA2 −265T >C in the BPRHS, GRCh37/hg19 approximate coordinates: chr1:161,134,000–1,612,215,000. (A) Under low saturated fat intake or <22 g/d (low-SFA), B) under high saturated fat intake or ≥ 22 g/d (high-SFA). The vertical axis displays the –log10(P value) of association, whereas the horizontal axis displays the physical position of CpG sites and genes (genome build 37). Each blue dot depicts one CpG site. The dashed line indicates the threshold of epigenome-wide significance at P = 1.1 × 10⁻⁷. ADAMTS4, a disintegrin and metalloproteinase with thrombospondin motifs 4; APOA2, apolipoprotein A-II; BPRHS, Boston Puerto Rican Health Study; B4GALT3, Beta-1,4-Galactosyltransferase 3; FCER1G, Fc fragment of IgE receptor Ig; NDUFS2, NADH:ubiquinone oxidoreductase core subunit S2; NR1I3, nuclear receptor subfamily 1 group I member 3; PPOX, protoporphyrinogen oxidase; TOMM40L, translocase of outer mitochondrial membrane 40 like.

