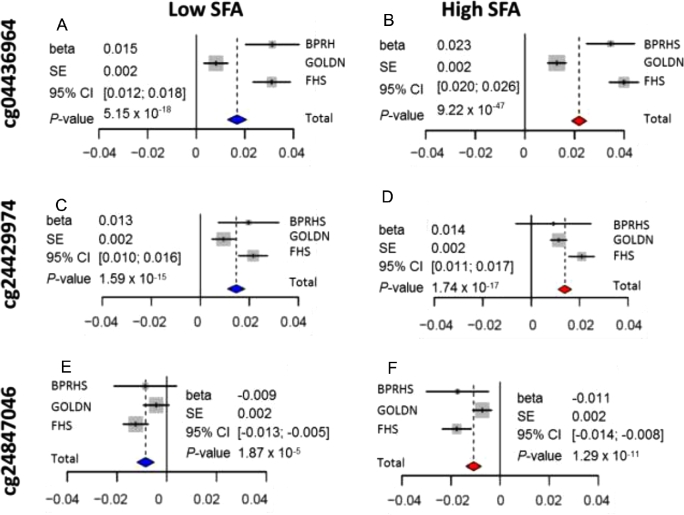
Figure 3.
Forest plots of meta-analysis of methylation differences at 3 methylation sites over 3 populations (BPRHS, GOLDN, and FHS) between CC and TT genotypes according to low- and high-SFA intake. The summary of statistics (β, SE, 95% CI, P value) of the meta-analysis are listed on each panel: (A) cg04436964 at low-SFA intake; (B) cg04436964 at high-SFA intake; (C) cg24429674 at low-SFA intake; (D) cg24429674 at high-SFA intake; (E) cg24847046 at low-SFA intake; (F) cg24847046 at high-SFA intake. BPRHS, Boston Puerto Rican Health Study; FHS, Framingham Heart Study; GOLDN, Genetics of Lipid Lowering Drugs and Diet Network.

