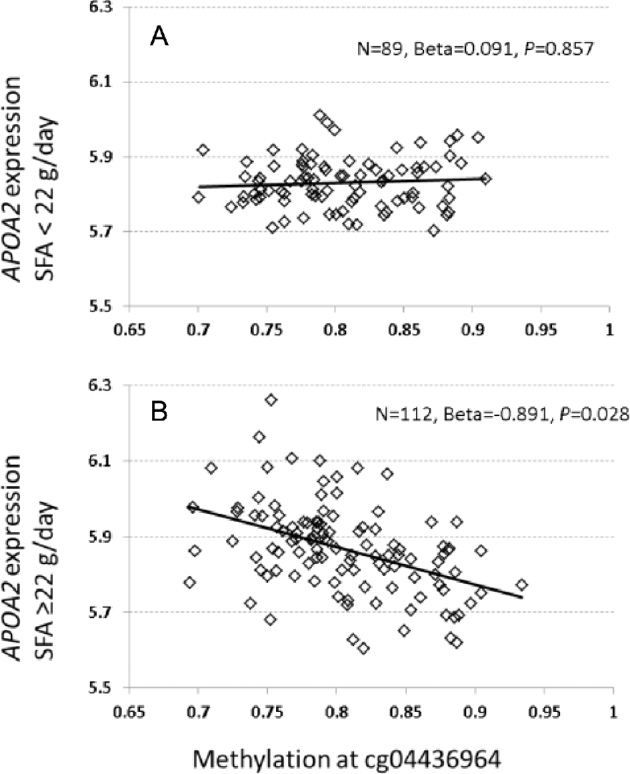
Figure 4.

Correlation between APOA2 mRNA expression in whole blood and methylation at cg04436964 in the FHS at exam 8. (A) Under low saturated fat intake or <22 g/d (low-SFA), (B) under high saturated fat intake or ≥22 g/d (high-SFA). The y-axis displays a normalized and log2-transformed signal of APOA2 mRNA expression adjusted for age, gender, and heterogeneity of cell type, whereas the x-axis displays the methylation level of cg04436964. APOA2, apolipoprotein A-II; FHS, Framingham Heart Study.
