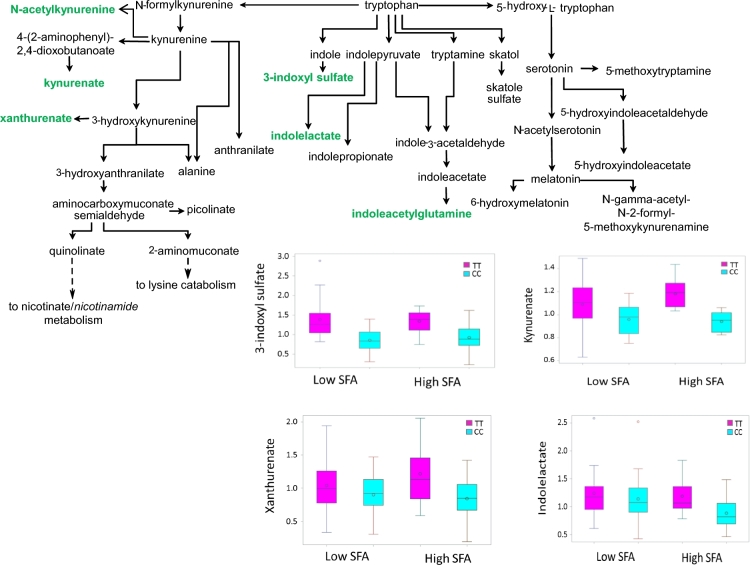
Figure 6.
CC homozygotes display perturbations in the tryptophan metabolism pathway. The metabolites highlighted in green were significantly (P < 0.05) decreased in CC genotype (cyan box) when compared with TT genotype (magenta box) with high-SFA intake. Box plots of 4 metabolites that met 2 criteria—1) differed between CC and TT genotypes, and 2) was associated with cg04436964—were shown according to APOA2 genotypes and SFA intakes. Inside the box, the empty circle indicates means and the horizontal lines are medians. The bottom and top edges of the box indicate the range of values between the first and third quartiles (the 25th and 75th percentiles), whereas whiskers indicate the data range outside the box. Beyond the whiskers are the outliers.

